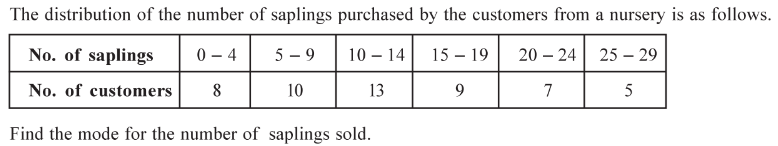
Question

Image

Answer

$M=₹ 863.64 P_{73}=₹ 994.32$

Need a full question paper?

Generate a complete, print-ready paper with questions like this in minutes — across 16+ boards, with answer keys.

Start Generating Free

Similar questions

The data on the profit of a company is as under. Present it by an appropriate diagram:
Year $2010$ $2011$ $2012$ $2013$ $2014$ $2015$
Profit (crore $₹$) $10$ $5$ $-2$ $4$ $8$ $6$
The information regarding the production (in lakh ?) in a factory during five years is given below. Present it in a suitable diagram.
The information of daily wages (in $Rs.$) of $230$ workers of a factory is given below. Calculate the coefficient of variation from the following data for the daily wages of workers :
Daily wages $(Rs)$ No. of workers
Less than $100$ $12$
Less than $200$ $30$
Less than $300$ $65$
Less than $400$ $107$
Less than $500$ $157$
Less than $600$ $202$
Less than $700$ $222$
Less than $800$ $230$
The frequency distribution of monthly saving of $400$ persons is as follows :
Saving $(₹)$ $0-1000$ $1001-2000$ $2001-3000$ $3001-4000$ $4001-6000$ $6001$ and more
No. of persons $25$ $40$ $50$ $150$ $90$ $45$
Answer the following questions from the frequency distribution :
$(i)$ Find the midvalue of the third class.
$(ii)$ Find the lower boundry point of the open ended class.
$(iii)$ Find number of persons having the saving more than $₹ 1000$ and less than $₹ 4001$.
$(iv)$ Find the class length of the fourth class.
$(v)$ Find number of persons having the saving of $₹ 4000$ or less.
The frequency distribution of number of cheques received per day for clearing of $5$ branches of a bank on $100$ days in the year $2014$ is as follows. Find the coefficient of skewness by Bowley’s method using this distribution.
The distribution of the share prices of a company on different days is given in the following table. Find the mode for the share prices using the graphical method.
The following table shows data about the distance travelled: (in km) by a salesman on different days. Find median, $Q_3, D_8, P_{62}$ and interpret them:
Distance travelled (km) $0 – 100$ $100 – 200$ $200 – 300$ $300 – 400$ $400 – 500$ $500 - 600$
No. of days $5$ $18$ $24$ $7$ $5$ $1$
We obtain the cumulative frequency distribution for the given frequency distribution.
The time between placing an order and its delivery was noted for a certain wholesaler as follows. Find the mode for this time.

Image
Find an appropriate measure of dispersion from the following data. Also find its relative measure.
Marks Less than $10$ $10 – 20$ $20 – 30$ $30 – 40$ Above $40$
No. of students $2$ $4$ $10$ $3$ $1$