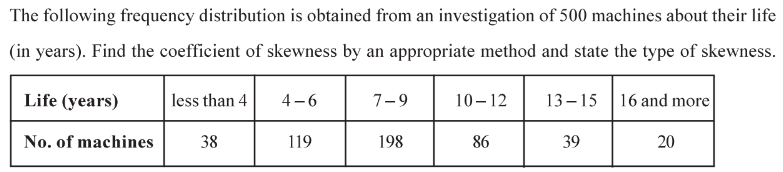
Question

Image

Answer

$Q_1=5.69$ Years, $M=7.91$ Years, $Q_3=10.20$ Years, $j=0.02$ Positive Skewness

Need a full question paper?

Generate a complete, print-ready paper with questions like this in minutes — across 16+ boards, with answer keys.

Start Generating Free

Similar questions

The information of profits (in lakh $?$) of $50$ firms in the last year is given below. Find the standard deviation of the profit of the firms.
Image
The monthly consumption of cotton (in thousand bales) of $35$ cloth mills is as follows.
Using this, find skewness and its coefficient by Karl Pearson's method. State the type of skewness.
Consumption of cotton (thousand bales)
$0-2$ $2-6$ $6-12$ $12-20$ $20-22$
No. of mills
$3$ $10$ $7$ $12$ $3$
The weekly income (in $Rs$) of $40$ employees of a firm are as follows. Taking class length $15$ and mid value of one class $497.5$, prepare exclusive continuous frequency distribution.
$539,526,514,500,488,460,477,499,503,508,520,544$, $463,548,532,518,548,542,516,532,461,504,495,480$, $498,506,523,540,549,490,500,489,480,540,485$, $523,505,549,495,469 .$
Out of $300$ persons residing in a region, a sample of $30$ persons is selected at random and the heights (in $cm$.) of these selected persons are as under :
$\text{163 148 151 162 145 152 149 158 153 149 150 152 145 141 162 168 148 158 149 141 146 155 159 150 161 153 162 160 154 165}$
$(i)$ Distribute these data into $6$ classes and also find the mid value of each class.
$(ii)$ Obtain ‘less than’ type cumulative frequency distribution.
$(iii)$ What is the percentage of persons having height less than $155 \ cm.$?
$(iv)$ Obtain ‘more than’ type cumulative frequency distribution.
$(v)$ How many persons have the height between $147$ to $157 \ cm.$?
The wheat crop grown per acre by farmers in different parts of a state is given below.
Wheat crop acre (quintals) $20 – 25$ $25- 30$ $30- 40$ $40 – 50$ $50 – 60$
No. of farmers $12$ $23$ $45$ $29$ $7$
A producer believes that the mode of his daily production is $70.$ The distribution of production from the data obtained after making some changes in the design of the produced units is as follows :
No. of units $60 – 64$ $65- 69$ $70 – 74$ $75 – 79$ $80 – 84$ $85 – 89$ $90 -94$
No. of days $5$ $7$ $10$ $8$ $5$ $3$ $2$
Is there any change in the mode of the number of items produced ? .
The average monthly transportation cost of $200$ families in a city in the year $2014$ is as follows. Find skewness and coefficient of skewness using Karl Pearson’s method.
In $100$ different days during a year, minimum $20$ and maximum $149$ pilgrims visited a religious place. Its frequency distribution is as follows. Find the coefficient of skewness using Bowley's method by preparing an inclusive frequency distribution taking class length $10$ for the first class.
No. of pilgrims (less than) $29$ $49$ $69$ $99$ $129$ $149$
No. of days $8$ $21$ $48$ $75$ $90$ $100$
The frequency distribution of number of foreign tours of $100$ persons is as follows. Find the coefficient of skewness by Karl Pearson's method.
No. of foreign tours $1$ $2$ $3-4$ $5-8$ $9--14$ $15-25$ $26-50$
No. of persons $8$ $12$ $18$ $24$ $18$ $12$ $8$
Following data are obtained for two groups $G_{1}$ and $G_{2}$ Find combined mean and combined standard deviation.
Group $G_{1}: n_{1}=20 ; \bar{x}_{1}=35 ; S_{1}^{2}=15$
Group $G_{2}: n_{2}=30 ; \bar{x}_{2}=40 ; S_{2}^{2}=12$