Question
Analyze the following statistics by presenting them in a divided column.
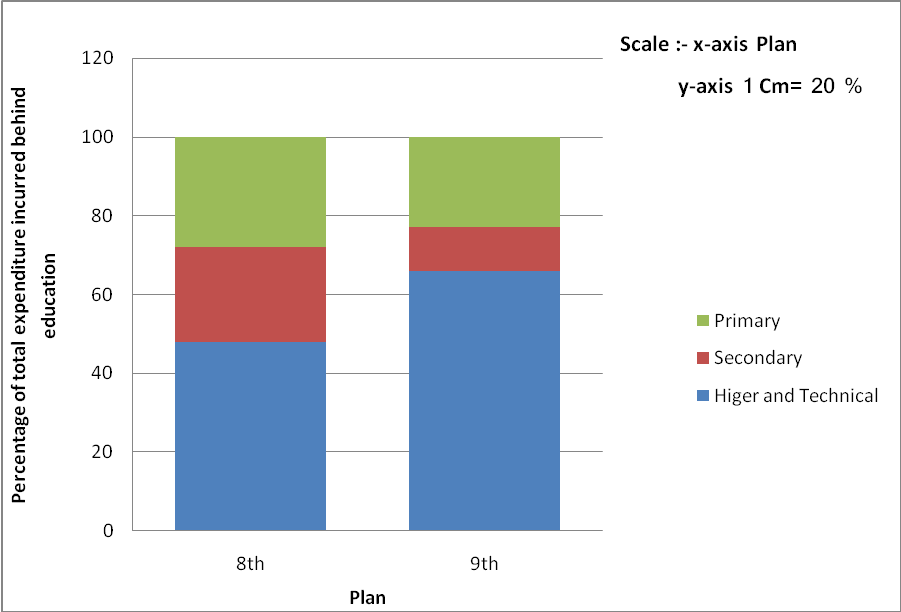
$PLAN$ Percentage of total expenditure incurred behind education Total
Primary Secondary Higher and technical
${8^{T H}(1992-97)}$ $48$ $24$ $28$ $100$
${9^{T H}(1997-2002)}$ $66$ $11$ $23$ $100$

Answer

The plan on $x-$axis and the percentage of expenditure on education on $Y$-axis will be divided as follows:
Analysis:
$(1)$ The figure shows the duration of the Eighth and Ninth Five Year Plan on the $x$-axis and the percentage of education expenditure on the $y-$axis.
$(2)$ The Ninth Plan $(1997-20002)$ has spent $37.5$ per cent more on primary education than the Eighth Plan $(1992-97).$
$(3)$ The percentage of expenditure on secondary education in the Ninth Plan as well as the percentage of expenditure on higher and technical education has been reduced by about $54\%$ and $18\%$ as compared to the $8th$ Plan respectively.
$(4)$ The Ninth Plan allocates more money to the costs behind primary education, suggesting a rapid increase in literacy.

Need a full question paper?

Generate a complete, print-ready paper with questions like this in minutes — across 16+ boards, with answer keys.

Start Generating Free