Question
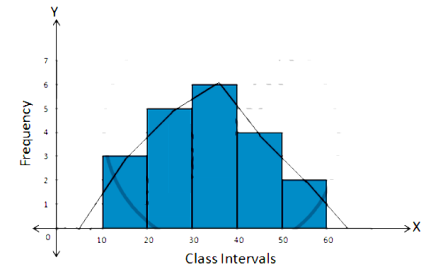
Construct a combined histogram and frequency polygon for the following frequency distribution:
Class$-$Intervals $10 - 20$ $20 - 30$ $30 - 40$ $40 - 50$ $50 - 60$
Frequency $3$ $5$ $6$ $4$ $2$

Answer

Steps:$1.$ Draw a histogram for the given data.
$2.$ Mark the mid$-$point at the top of each rectangle of the histogram drawn.
$3.$ Also, mark the mid$-$point of the immediately lower class$-$interval and mid$-$point of the immediately higher class$-$interval.
$4$. Join the consecutive mid$-$point marked by straight lines to obtain the required frequency polygon.
$5$. The require combined histogram and frequency polygon are shown in the following figure:
Image

Need a full question paper?

Generate a complete, print-ready paper with questions like this in minutes — across 16+ boards, with answer keys.

Start Generating Free