Question
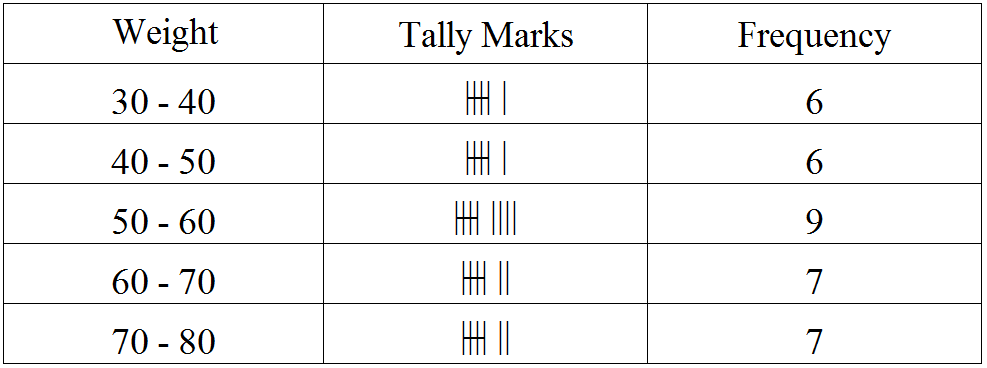
Construct a frequency table for the following weights (in gm) of 35 mangoes using the equal class intervals, one of them is 40-50 (45 not included):
30, 40, 45, 32, 43, 50, 55, 62, 70, 70, 61, 62, 53, 52, 50, 42, 35, 37, 53, 55, 65, 70, 73, 74, 45, 46, 58, 59, 60, 62, 74, 34, 35, 70, 68.
  1. What is the class mark of the class interval 40-45?
  2. What is the range of the above weights?
  3. How many classes are there?

Answer

​​​The frequency table for the given weights (in gm) of 35 mangoes is given below:
  1. Class mark for the class interval 40-45:
Class mark $=\frac{40+45}{2}=\frac{85}{2}=42.5$
  1. Range of the above weights:
Range = Highest value - Lowest value

= 74 - 30

= 44
  1. There are 5 classes (30-40, 40-50, 50-60, 60-70, 70-80).

Need a full question paper?

Generate a complete, print-ready paper with questions like this in minutes — across 16+ boards, with answer keys.

Start Generating Free

Similar questions

Solve the following equation and verify your answer:
$\frac{2\text{x}+1}{3\text{x}-2}=\frac{5}{9}$
Determine the number of sides of a polygon whose exterior and interior angles are in the ratio 1 : 5.
Draw a line l. Take a point A outside the line. Through point A draw a line parallel to line l.
The dimensions of a rectangular box are in the ratio of $2: 3: 4$ and the difference between the cost of covering it with sheet of paper at the rates of Rs. 8 and Rs. 9.50 per $m ^2$ is Rs. 1,248 . Find the dimensions of the box.
Various modes of transport used by 1260 students in a given school are given below:
School bus
Private bus
Bicycle
Rickshaw
On foot
350
245
210
175
280
Represent the above data by a pie chart.
$\frac{7}{\text{x}}+35=\frac{1}{10}$
Sudhir’s present age is 5 more than three times the age of Viru. Anil’s age is half the age of Sudhir. If the ratio of the sum of Sudhir’s and Viru’s age to three times Anil’s age is 5:6, then find Viru’s age.
PQRSTU is a regular hexagon. Determine each angle of $\triangle\text{PQT}$.
The number of boys and girls, in std 5 to std 8 in a Z.P. School is given in the table. Draw a subdivided bar graph to show the data. (Scale : On Y axis, 1cm = 10 students)
Standard5th6th7th8th
Boys34262125
Girls17141420
Observe the following pattern,
$1^2=\frac{1}{6}\big[1\times(1+1)\times(2\times1+1)\big]$
$1^2+2^2=\frac{1}{6}\big[2\times(2+1)\times(2\times2+1)\big]$
$1^2+2^2+3^2=\frac{1}{6}\big[3\times(3+1)\times(2\times3+1)\big]$
$1^2+2^2+3^2+4^2=\frac{1}{6}\big[4\times(4+1)\times(2\times4+1)\big]$
and find the values of each of the following:
  1. $1^2+2^2+3^2+4^2+\ .....\ +10^2$
  2. $5^2+6^2+7^2+8^2+9^2+10^2+11^2+12^2$