Tamilnadu BoardEnglish MediumSTD 12ChemistryChemical Kinetics2 Marks
Question
Describe the graphical representation of first order reaction.
✓
Answer
Rate constant for first order reaction is,
$
\begin{aligned}
& kt =\ln \left(\frac{\left[ A _0\right]}{[ A ]}\right) \\
& kt =\ln \left[ A _0\right]-\ln [ A ] \\
& \ln [ A ]=\ln \left[ A _0\right]- kt \\
& y = c + mx
\end{aligned}
$
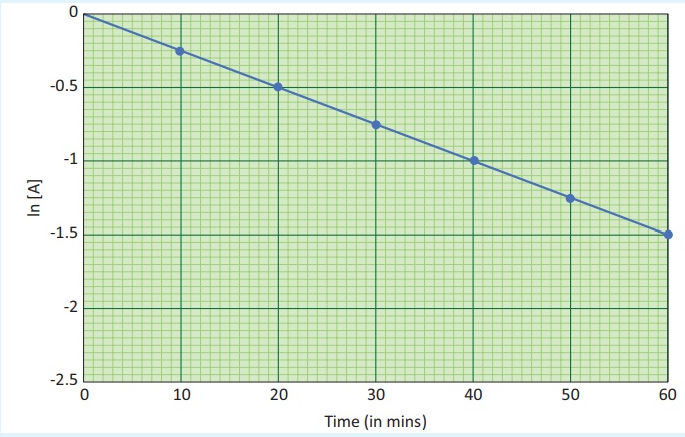
If we follow the reaction by measuring the concentration of the reactants at regular time intervals ' $t$ ', a plot of In [A] against ' $t$ ' yields a straight line with a negative slope. From this, the rate constant is calculated.
A plot of In $[A]$ Vs $t$ for a first order reaction,
$A \longrightarrow$ product
with initial concentration of $[A]=1.00 M$ and $k =2.5 \times 10^{-2} min ^{-1}$
Need a full question paper?
Generate a complete, print-ready paper with questions like this in minutes — across 16+ boards, with answer keys.