Question
Direction Analyse the following case study graph and answer questions (i) to (v) on the basis of the same.
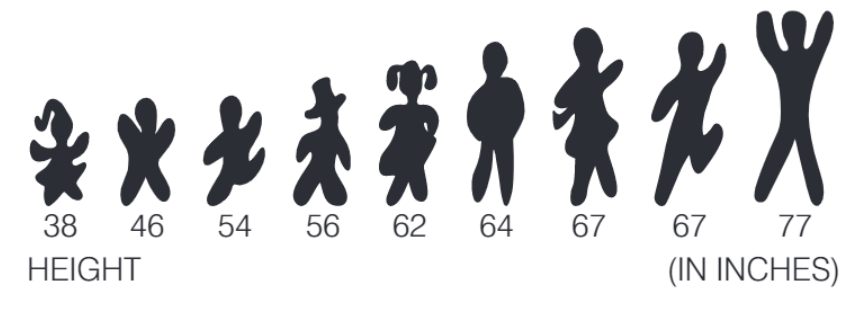
  1. What is the mean height of the above students?
  1. 54
  2. 59
  3. 62
  4. 67
  1. Median of a given series divides the data into ......... parts.
  1. Two
  2. Three
  3. Four
  4. None of these
  1. What will be the median value of the above figure?
  1. 52
  2. 56
  3. 62
  4. 65
  1. If we reverse the data in decreasing order, value of median will be:
  1. 52
  2. 55
  3. 64
  4. None of the above
  1. What will be the mode value in the above series?
  1. 54
  2. 59
  3. 67
  4. Can't be determined

Answer

  1. (b) 59
Explanation:

Mean $=\frac{38+ 46+ 54+ 56+ 62+64+67+67+77}{9}=59$
  1. (a) Two
Explanation:

Median is the middle most value which divides the series into two equal parts.
  1. (c) 62
Explanation:

Median $=\frac{(\text{n}+1)}{2}=\frac{(9+1)}{32}=5\text{th}\ \text{term}.$
  1. (d) None of the above
Explanation:

If we reverse the series, median value will still remain the same.
  1. (c) 67
Explanation:

In the above graph, 67 has appeared twice so mode will be equal to 67.

Need a full question paper?

Generate a complete, print-ready paper with questions like this in minutes — across 16+ boards, with answer keys.

Start Generating Free

Similar questions

Give advantages and disadvantages of quartiles, deciles and percentiles.
Calculate the demand schedule of Raju, using following table. (Assuming Market includes four buyers.)
Price (₹)Ramesh (Units)Raju (Units)Rahim (Units)Rina (Units)Market Demand (Units)
519-7632
420-10944
321-121151
222-141561
123-181974
At a given price, there is excess demand for a good. Explain how the equilibrium price will be reached. Use diagram.
How is a seller under perfect competition a price taker and not a price maker? What is the relevance of the characteristic that there are 'large number of sellers' in this context?
Why should MC curve be rising in a situation of producer's equilibrium?
Explain the chain of effects of an increase in supply of a commodity on its equilibrium price and quantity.
Direction Read the following case study and answer questions (i) to (v). On the basis of the same. Measures of central tendency are an effective statistical tools, which are widely used for different purposes. Two statistical series are given below, observe them carefully and answer the questions that follow.
Series1
Series2
2
Marks
No. of student
8
5-10
02
6
10-20
03
4
20-45
01
10
45-60
06
15
 
 
  1. What will be the median value of series 1?
  1. 6
  2. 8
  3. 10
  4. None of these
  1. Which of the following formula should be/used to calculate median in series 2?
  1. $\Big(\frac{\text{n}+1}{2}\Big)\text{th}\ \text{term}$
  2. $\Big(\frac{\text{N}+1}{2}\Big)\text{th}\ \text{term}$
  3. $\Big(\frac{\text{N}+1}{2}\Big)\text{th}\ \text{term}$
  4. $\text{None of these}$
  1. Mode value of series 2 will be equal to ...
  1. 12
  2. 16
  3. 28
  4. Can't be determined
  1. Which of the following methods should be used to calculate mode in series 1?
  1. Observation method.
  2. Grouping table method.
  3. Empirical relation between central tendencies.
  4. Can't be determined.
  1. What will be the mode value in series 1?
  1. 6
  2. 8
  3. 10
  4. None of the above
Which measure of dispersion is the best and how?
Calculate the correlation coefficient between X and Y and comment on their relationship.
X
1
3
4
5
7
8
Y
2
6
8
10
14
16
How is correlation different from causation?