Question
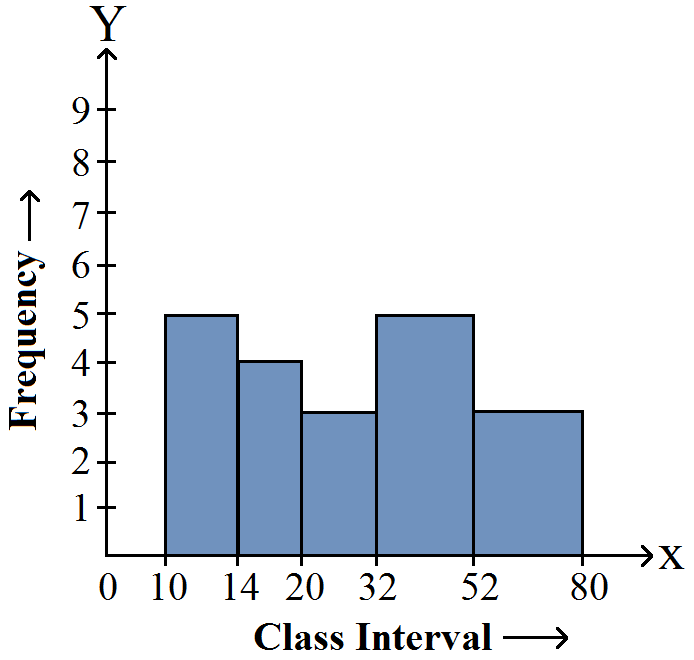
Draw a histogram to represent the following data:
|
Class interval
|
$10-14$
|
$14-20$
|
$20-32$
|
$32-52$
|
$52-80$
|
|
Frequency
|
$5$
|
$6$
|
$9$
|
$25$
|
$21$
|