Question
Draw a line segment PQ = 6.2cm. Draw the perpendicular bisector of PQ.

Answer


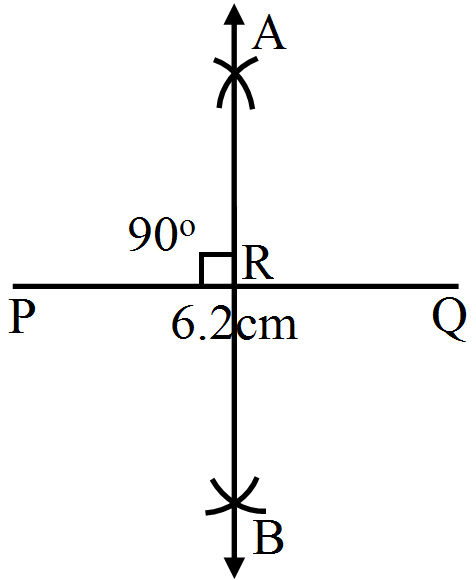
Steps for construction:
  1. Draw a line segment PQ, which is equal 6.2cm.
  2. With P as the centre and radius more than half of PQ, draw arcs, one on each side of PQ.
  3. With Q as the centre and the same radius as before, draw arcs cutting the perviously drawn arcs at A and B, respectively.
  4. Draw AB, meeting PQ at R.

Need a full question paper?

Generate a complete, print-ready paper with questions like this in minutes — across 16+ boards, with answer keys.
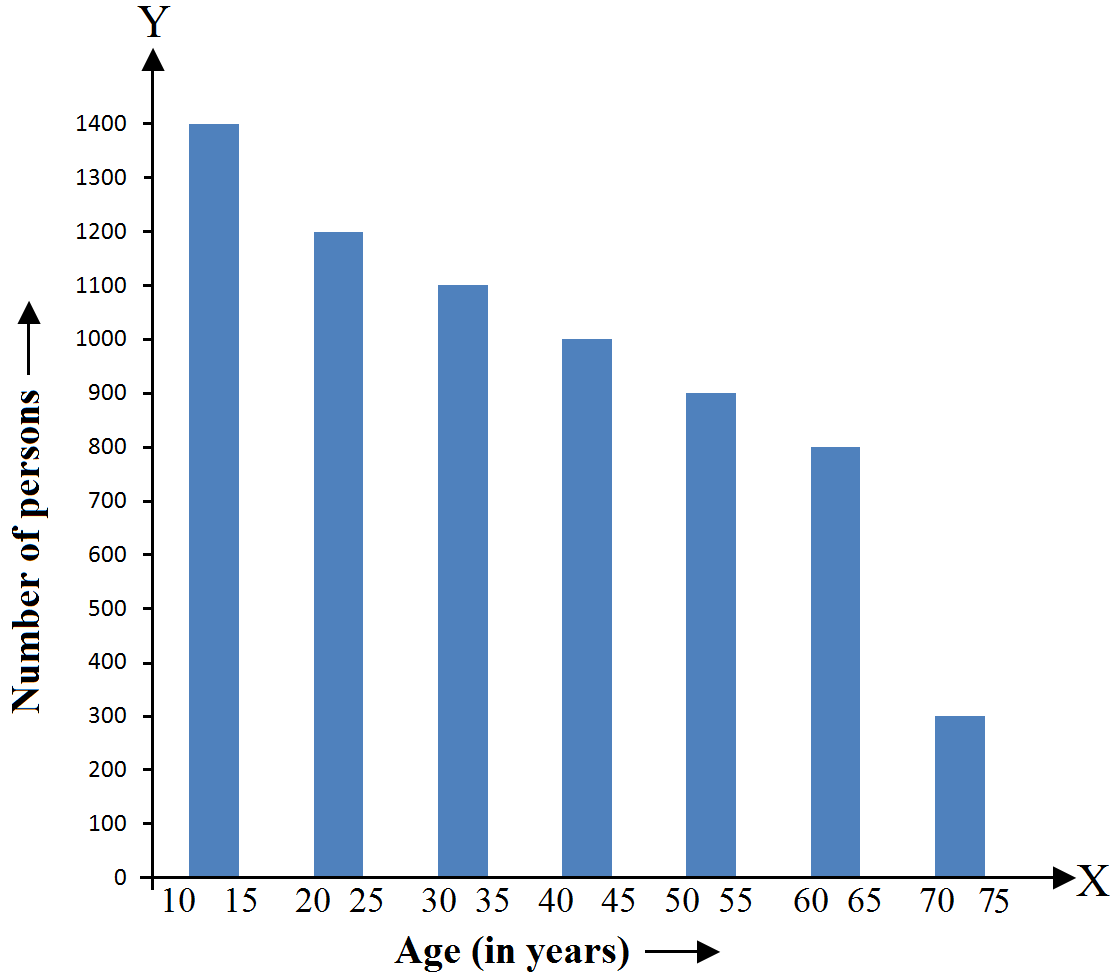
Start Generating Free

Similar questions

Determine the number nearest to 100000 but greater than 100000 which is exactly divisible by each of 8, 15 and 21.
Draw a rectangle whose two adjacent sides are 5cm and 3.5cm. Make use of a pair of compasses and a ruler only.
Carry out the following Divisions:
i. $\frac{2}{3} \div \frac{1}{4}$
ii. $\frac{5}{9} \div \frac{3}{2}$
iii. $\frac{3}{7} \div \frac{5}{11}$
iv. $\frac{11}{12} \div \frac{4}{7}$
$3 \frac{1}{5}+2 \frac{1}{3}$
Study the bar graph representing the number of persons in various age groups in a town shown in Observe the bar graph and answer the following questions:
  1. What if the percentage of the youngest age-group persons over those in the oldest age group?
  2. What is the total population of the town?
  3. What is the number of persons in the age-group 60-65?
  4. How many persons are more in the age-group 10-15 than in the age group 30-35?
  5. What is the age-group of exactiy 1200 persons living in the town?
  6. What is the total number of persons living in the town in the age-group 50-55?
  7. What is the total muner of persons living in the town in the age-groups 10-15 and 60-65?
  8. Whether the population in general increases, decreases or remains constant with the increase in the age-group.
Draw a line l. Take a point A, not lying on l. Draw a line m such that $\text{m}\perp\text{l}$ and passing through A. Using ruler and compasses.
Find the greatest number that will divide 445, 572 and 699, leaving remainders 4, 5, 6 respectively.
Add:
  1. 8 + 6
  2. 9 + (-3)
  3. 5 + (-6)
  4. – 7 + 2
  5. – 8 + 0
  6. – 5 + (-2)
The following table shows the number of maruti cars sold by five dealers in a particular month:
Dealer
Saya
Bagga Links
D.D Motors
Bhasin Motor
Competent Motors
Cars Sold
60
40
20
15
10
Represent the above information by a pictograph.
Following figures relate the weekly wages (in Rs.) of 15 workers in a factory:
300, 250, 200, 250, 200, 150, 350, 200, 250, 200, 150, 300, 150, 200, 250
Prepare a frequency table
  1. What is the range in wages (in Rs.)?
  2. How many Workers are getting Rs. 350?
  3. How many of workers are getting the minimum wages?