Question
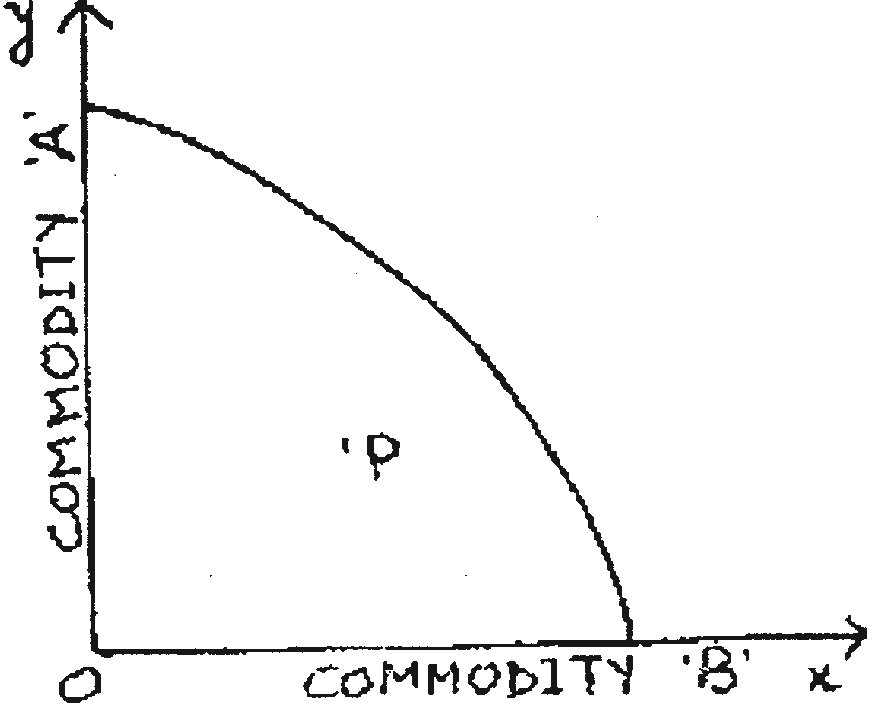
Draw a production possibility curve. What does a point below this curve indicate? Explain.

Answer


Explanation about pt. P.

Need a full question paper?

Generate a complete, print-ready paper with questions like this in minutes — across 16+ boards, with answer keys.

Start Generating Free

Similar questions

When price of a good falls from ₹ 20 to ₹ 10 per unit, producer reduces supply from 100 units to 50 units. Calculate price elasticity of supply.
Give reasons for the following statements:
  1. Demand curve facing a perfectly competitive firm is a horizontal straight line.
  2. Demand curve facing a monopolistic competitive firm is a downward sloping curve.
  3. Demand curve facing a monopoly firm is less elastic than that curve facing a monopolistic competitive firm.
What is maximum price ceiling? On what type of goods is it normally imposed? Use diagram.
Complete the following table:
Output (Units)
Total Variavle Cost (TVC) (₹)
Average Variable Cost (AVC) (₹)
Marginal Cost (MC) (₹)
1
__
12
__
2
20
__
__
3
__
10
10
4
40
__
__
The following table shows the total revenue and total cost schedules of a competitive firm. Calculate the profit at each output level. Determine also the market price of the good.
Quantity
TR (Rs)
TC(Rs)
Profit
0
1
2
3
4
5
6
7
0
5
10
15
20
25
30
35
5
7
10
12
15
23
33
40
 
What does the law of variable proportions show? State the behaviour of marginal product according to this law.
OR
State the different phases of law of returns to a factor in terms of behaviour of marginal product. Represent the same in the diagram.
OR
State the likely behaviour of marginal product under the law of variable proportions.
OR
Explain the law of variable proportions in terms of marginal product with the help of a diagram.
OR
Prepare a marginal product schedule when for increasing production only one input is increased. Indicate the phases of law of variable proportions.
When the price of a commodity falls from 10 per unit to 9 per unit, its quantity supplied falls by 20 percent.
Explain the law of supply with the help of supply schedule.
When price of a good is Rs. 7 per unit a consumer buys 12 units. When price falls to Rs. 6 per unit he spends Rs. 72 on the good. Calculate price elasticity of demand by using the percentage method. Comment on the likely shape of demand curve based on this measure of elasticity.
State the assumptions of Production Possibility Curve.
OR
State any three assumptions on which a production possibility curve is based.