Question
Draw a scatter diagram and interpret whether the correlation is positive or negative.
|
X
|
4
|
5
|
6
|
7
|
8
|
9
|
10
|
11
|
12
|
13
|
14
|
15
|
|
Y
|
78
|
72
|
66
|
60
|
54
|
48
|
42
|
36
|
30
|
24
|
18
|
12
|
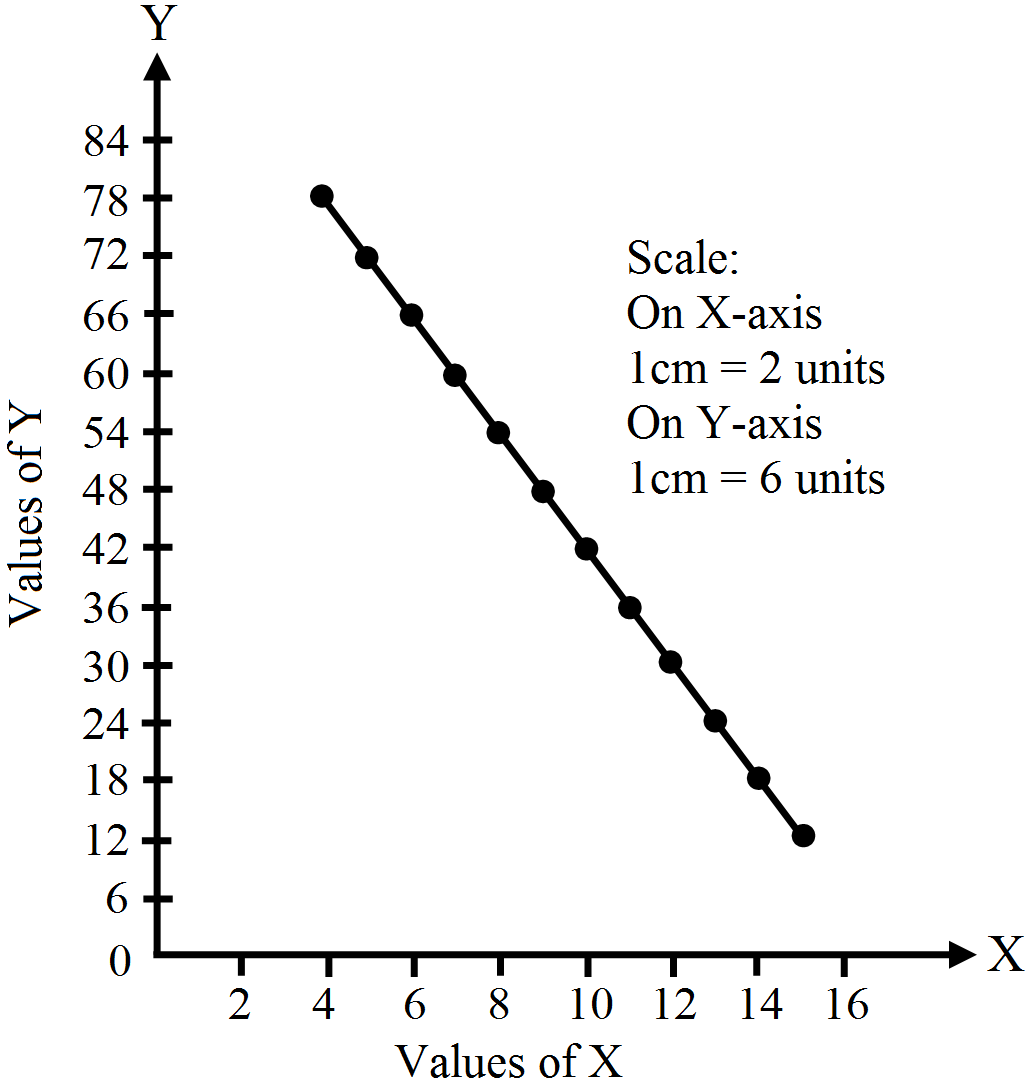 The diagram indicates that there is perfect negative correlation between the values of the two variables X and Y.