Question
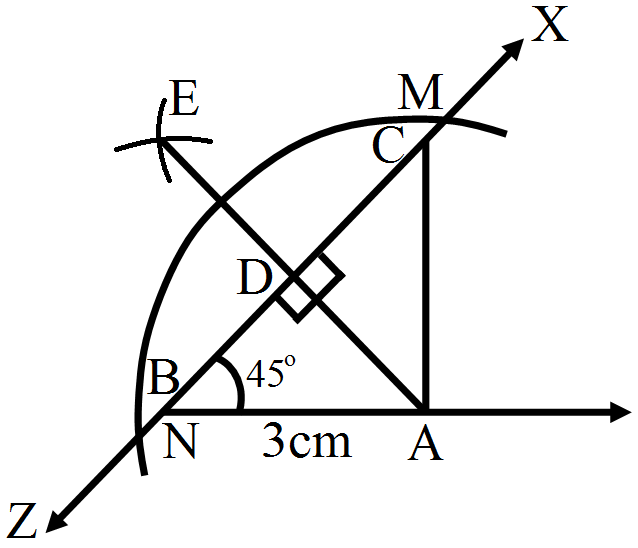
Draw a triangle ABC in which BC = 4cm, AB = 3cm and $\angle\text{B}=45^\circ.$ Also, draw a perpendicular from A on BC.

Answer


Steps of construction:
Step I: Draw a line segment AB of length 3cm.
Step II: Draw an angle of 45° and cut an arc at this angle at a radius of 4cm at C.
Step III: Join AC to get the required triangle.
Step IV: With A as centre, draw intersecting arcs at M and N.
Step V: With centre M and radius more than half of MN, cut an arc on the opposite side of A.
Step VI: With N as centre and radius the same as in the previous step, cut an arc intersecting the previous arc at E.
Step VII: Join AE, it meets BC at D, then AE is the required perpendicular.

Need a full question paper?

Generate a complete, print-ready paper with questions like this in minutes — across 16+ boards, with answer keys.

Start Generating Free

Similar questions

Gold prices on 4 consecutive Tuesdays were as under:
Week First Second Third Fourth
Rate per 10gm (in Rs.) 8500 8750 9050 9250
Draw a bar graph to show this imformation.
Suvidya borrowed a sum of Rs 30000 at 8 p.c.p.a. interest for a year from her bank to buy a computer. At the end of the period, she had to pay back an amount of Rs 2400 over and above what she had borrowed.
Based on this information fill in the blanks below.
  1. Principal = Rs__
  2. Rate of interest =__%
  3. Interest = Rs__
  4. Time =__year.
  5. The total amount returned to the bank = 30,000 + 2,400 = Rs__
Find the time when:
Divide Rs. 3600 into two parts such that if one part be lent at 9% per annum and the other at 10% per annum, the total annual income is Rs. 333.
Shubhangi has twice as many 20-rupee notes as she has 50-rupee notes. Altogether, she has 2700 rupees. How many 50-rupee notes does she have ?
The following table shows the imports (in thousand crore rupees) made by India over the last five years. Draw a bar graph to represent this data.
Year
2001-02
2002-03
2003-04
2004-05
2005-06
Imports (in thousand crore rupees)
148
176
204
232
180
The table given below shows the population of four towns over two years:
Towns
A
B
C
D
2016
640000
830000
460000
290000
2017
750000
920000
630000
320000
  1. Draw a double bar graph using approprtate scale to depict the information given above.
  2. In which town was the population growth maximum?
  3. In which town was the population growth least?
The production of saleable steel in some of the steel plants of our country during 1999 is given below:
Plant
Bhilai
Durgapur
Rourkela
Bokaro
Production(in thousand tonnes)
160
80
200
150
Construct a bar graph to represent the above data on a graph paper by using the scale 1 big division=20 thousand tonnes.
Students should take examples of their own and practice construction of triangles.
i. In ∆PQR, l(PQ) = 5 cm, l(QR) = 6.8 cm, l(PR) = 5.5 cm.
ii. In ∆XYZ, l(XY) = 5.7 cm, m∠Y = 120°, l(YZ) = 7 cm.
iii. In ∆RST, l(ST) = 6.7 cm, m∠S = 60°, m∠T = 40°.
iv. In ∆UVW, m∠U = 90°, l(UV) = 5 cm, l(VW) = 6 cm.
The table below shows the number of people who had the different juices at a juice bar on a Saturday and a Sunday. Draw a joint bar graph for this data.
Days\FruitsSweet LimeOrangeApplePineapple
Saturday47wQbNPTDJp9hMYdvogK2hAUiHsGeiybwaWe36bwtRQ3UTpYV7YuZ8FV5j9nauFCWwcjM6dTzpL5s2N79Rp5unwdMvc8ZKU="125">5640
Sunday59657867
The following data gives the production of food grains (in thousand tonnes) for some years:
Year
1995
1996
1997
1998
1999
2000
Production(in thousand tones)
120
150
140
180
170
190
Represent the above data with the help of a bar graph.