Question
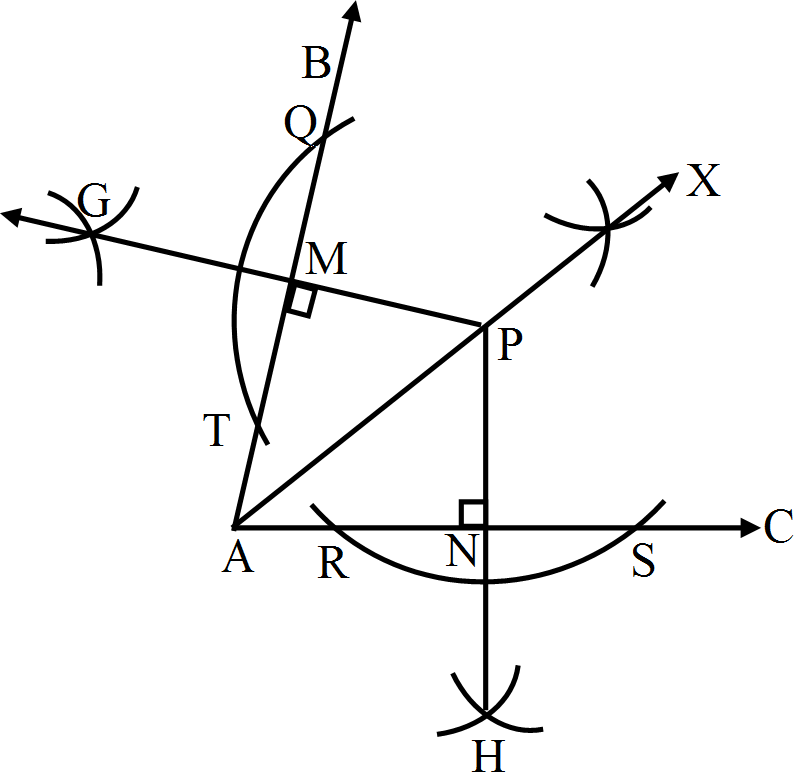
Draw an angle and label it as $\angle\text{BAC}.$ Draw its bisector ray $AX$ and take a point $P$ on it. From $P$ draw line segments $PM$ and $PN,$ such that $\text{PM}\perp\text{AB}$ and $\text{PN}\perp\text{AC},$ where $M$ and $N$ are respectively points on rays $AB$ and $AC.$ Measure $PM$ and $PN.$ Are the two lengths equal$?$

Answer

$i.\ $Draw $\angle\text{BAC}$ on the line segment $AC.$
With a convenient radius and $A$ as centre, draw an arc from $AB$ and $AC$.
$ii.\ $The points where arc cuts $AB$ and $AC,$ take both points as centres and draw two small arcs intersecting at $X.$ Now, draw $AX.$
$iii.\ $Take a point $P$ on the ray $AX.$
$iv.\ $Take a convenient radius with $P$ as centre and construct an arc intersecting the line segments $AB$ at $T$ and $Q$ and $AC$ at $R$ and $S,$ respectively.
$v.\ $Using the same radius and with $T$ and $Q$ as centres, construct two arcs intersecting at $G$ on the other side.
$vi.\ $Using the same radius and with $R$ and $S$ as centres, construct two arcs intersecting at $H$ on the other side.
$vii.\ $Join $PG$ and $PH,$ which intersects $AB$ and $AC$ at $M$ and $N,$ respectively.
On measuring $PM$ and $PN$ using a ruler, we find that both are equal.

Need a full question paper?

Generate a complete, print-ready paper with questions like this in minutes — across 16+ boards, with answer keys.

Start Generating Free

Similar questions

The population of Delhi State in different census years is as given below:
Census year
$1961$
$1971$
$1981$
$1991$
$2001$
Cars Sold
$30$
$55$
$70$
$110$
$150$
Represent the above information with the help of a bar graph.
Total number of students of a school in different years is shown in the following table:
Year
Number of students
$1996$
$400$
$1998$
$550$
$2000$
$450$
$2002$
$600$
$2006$
$650$
Represent the above data by a pictograph. Prepare a pictograph of students using one symbol an icon of a student to represent students and answer the following questions:
$i.\ $How many symbols represent total number of students in the year $2002$?
$ii.\ $How many symbols represent total number of students for the year $1998$?
Refer to question $23.$ Prepare a bar graph of the data.
Draw any three triangles and write the measures of their angles adjacent to the corresponding vertices. For each triangle add up the three measures. What do you get?
Find the perimeter of each of the following shapes:
Image
Total number of students of a school in different years is shown in the following table:
Years19961998200020022004
Number of students400550450600650
Represent the above data by a pictograph.
(a) Prepare a pictograph of students using one symbol an icon of a student to represent 100 students and answer the following questions:
(i) How many symbols represent total number of students in the year 2002?
(ii) How many symbols represent total number of students for the year 1998?
Catherine threw a dice 40 times and noted the number appearing each time as shown below :
$1$ $3$ $5$ $6$ $6$ $3$ $5$ $4$ $1$ $6$
$2$ $5$ $3$ $4$ $6$ $1$ $5$ $5$ $6$ $1$
$1$ $2$ $2$ $3$ $5$ $2$ $4$ $5$ $5$ $6$
$5$ $1$ $6$ $2$ $3$ $5$ $2$ $4$ $1$ $5$
Make a table and enter the data using tally marks. Find the number that appeared the maximum number of times.
Use a pair of compasses and construct the following angles:
$67\frac{1}{2}^\circ$
There are $20$ girls and $15$ boys in a class. What is the ratio of number of girls to the total number of students in the class?
Draw the perpendicular bisector of a given line segment $AB$ of length 6cm.