Question
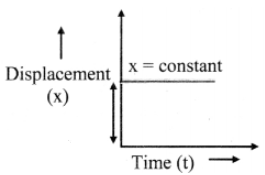
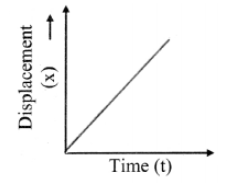
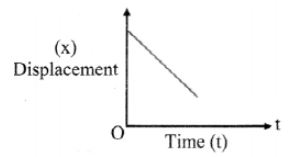
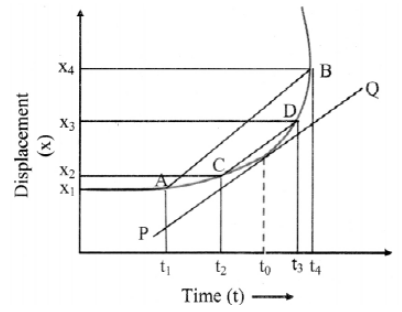
Draw and explain the position-time graph of:
  1. An object at rest.
  2. An object moving with uniform velocity along positive x-axis.
  3. An object moving with uniform velocity along negative x-axis.
  4. An object moving with non-uniform velocity.
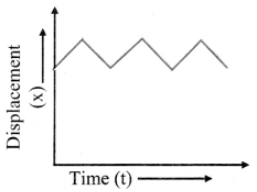
  5. An object performing oscillatory motion with constant speed.

Answer

1.The position-time graph of an object at rest:
  • For an object at rest, the position-time graph is a horizontal straight line parallel to time axis.
  • The displacement of the object is zero as there is no change in the object’s position.
  • Slope of the graph is zero, which indicates that velocity of the particle is zero.
    Image
    2. The position-time graph of an object moving with uniform velocity along positive $x$-axis:
    • When an object moves, the position of the particle changes with respect to time.
    • Since velocity is constant, displacement is proportional to elapsed time.
    • The graph is a straight line with positive slope, showing that the velocity is along the positive x -axis.
    • In this case, as the motion is uniform, the average velocity and instantaneous velocity are equal at all times.
    • Speed is equal to the magnitude of the velocity.

    Image

3. Position-time graph of an object moving with uniform velocity along negative $x$ - axis:
• The graph is a straight line with negative slope, showing that the velocity is along the negative $x$-axis.
• Displacement decreases with increase in time.
Image
4. Position-time graph of a particle moving with non-uniform velocity;
• When the velocity of an object changes with time, slope of the graph is different at different points. Therefore, the average and instantaneous velocities are different.
• Average velocity over time interval from $t_1$ to $t_4$ around time $t_0=$ slope of line $A B$.
• Average velocity over time interval from $t_2$ to $t_3=$ slope of line CD
• On further reducing the time interval around $t_0$, it can be deduced that, instantaneous interval at $t _0=$ the slope of the tangent $P Q$ at $t _0$.
Image
5. Position-time graph of an object performing oscillatory motion with constant speed:
For an object performing oscillatory motion with constant speed, the direction of velocity changes from positive to negative and vice versa over fixed intervals of time.
Image

Need a full question paper?

Generate a complete, print-ready paper with questions like this in minutes — across 16+ boards, with answer keys.

Start Generating Free