Question
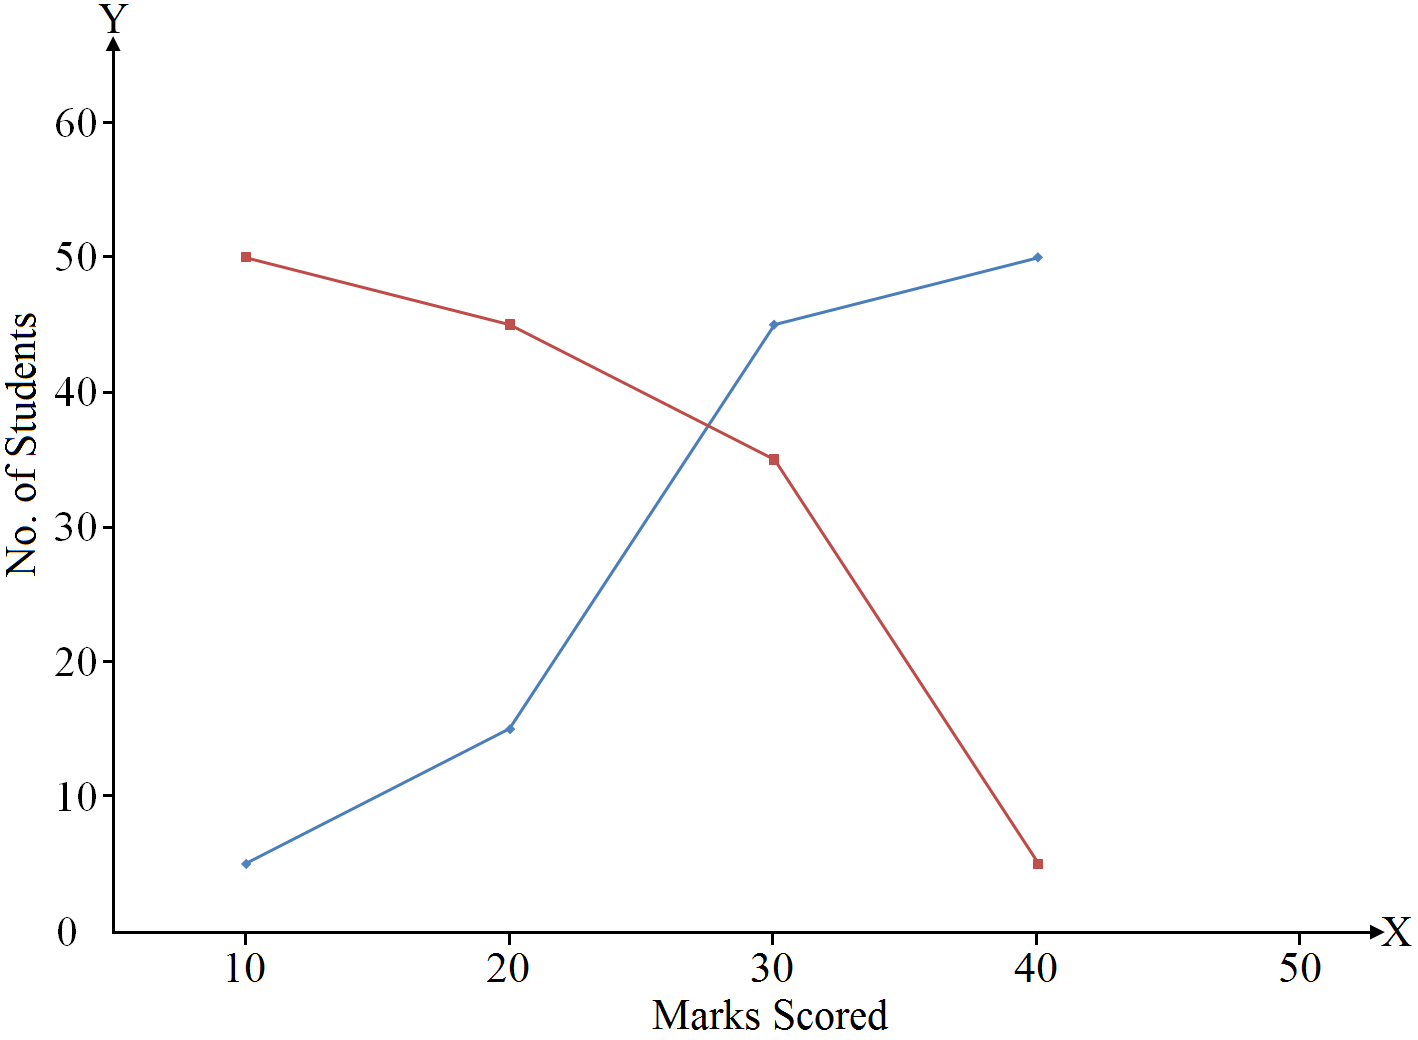
Draw less than and more than ogive (cumulative frequency curve) using the given data:
|
Marks Scored
|
10-20
|
20-30
|
30-40
|
40-50
|
|
No. of Students
|
5
|
10
|
30
|
5
|