Question
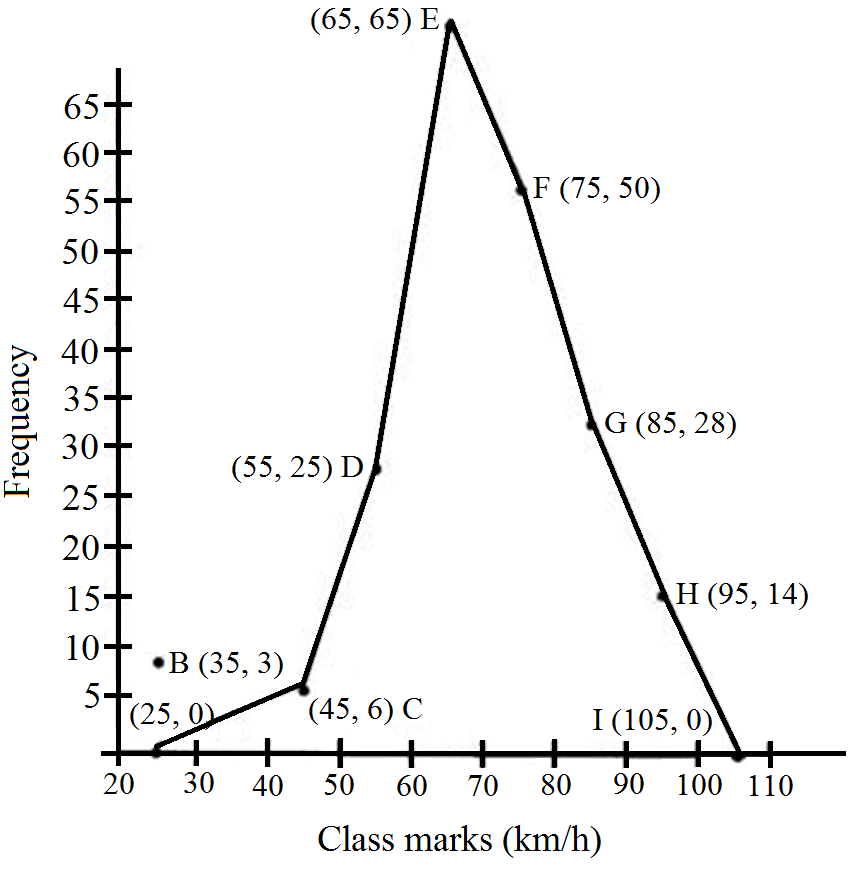
Draw the frequency polygon representing the above data without drawing the histogram.
|
Class interval (km/ h)
|
Class marks
|
Frequency
|
|
30-40
40-50
50-60
60-70
70-80
80-90
90-100
|
35
45
55
65
75
85
95
|
3
6
25
65
50
28
14
|
Generate a complete, print-ready paper with questions like this in minutes — across 16+ boards, with answer keys.