Question
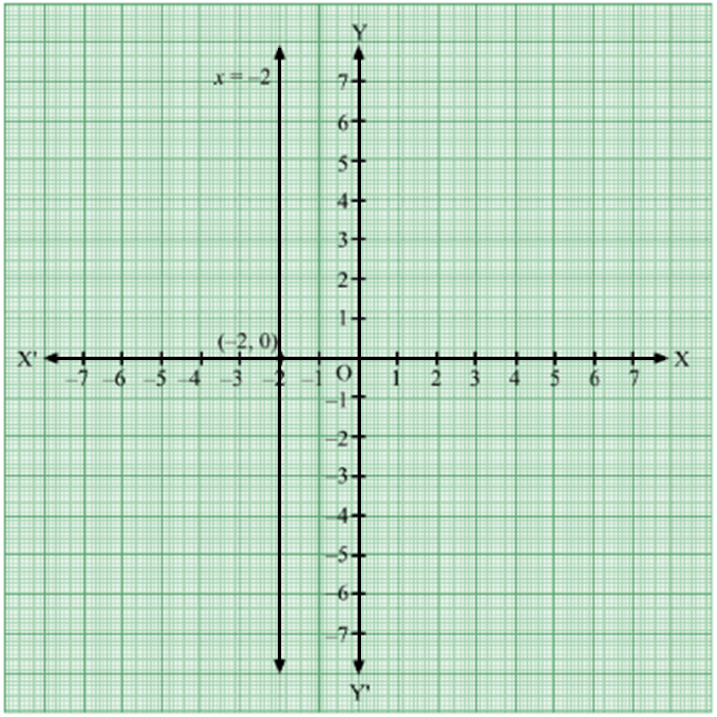
Draw the graph of the following equation. $x = -2$
Generate a complete, print-ready paper with questions like this in minutes — across 16+ boards, with answer keys.
|
Variables ($x_i$)
|
$10$
|
$30$
|
$50$
|
$70$
|
$89$
|
|
Frequency ($f_i$)
|
$7$
|
$8$
|
$10$
|
$15$
|
$10$
|