Question
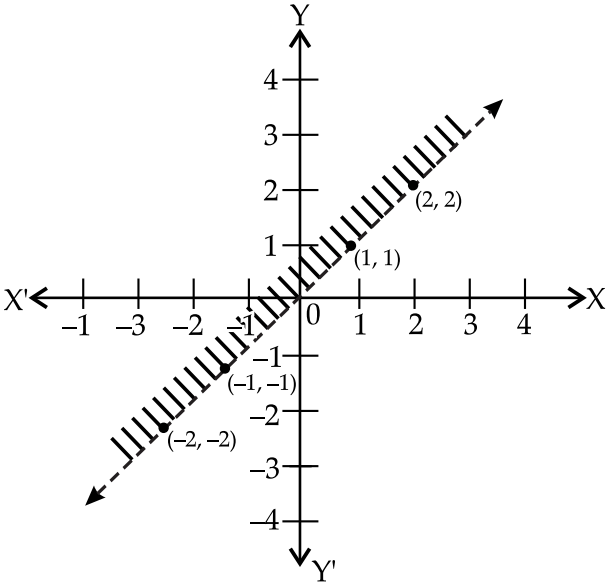
Draw the graph of the solution set of $x < y.$

Need a full question paper?

Generate a complete, print-ready paper with questions like this in minutes — across 16+ boards, with answer keys.

Start Generating Free

Similar questions

Fit a straight line trend by the method of least squares to the data given below:
Year2012201320142015201620172018
Sales ( in tones)9111312141517
Riya invested ₹ 20,000 in a mutual fund in year 2016. The value of mutual fund increased to ₹ 32,000 in year 2021. Calculate the compound annual growth rate of her investment. [Given, $\log (1.6)=0.2041$, antilog $(0.04082)=1.098]$
Find the student's -t for the following variable values in a sample of eight:
-4, -2, -2, 0, 2, 2, 3, 3 taking the mean of the universe to be zero.
Ten individuals are chosen at random from the population and their heights are found to be in inches 63, 63, 64, 65, 66, 69, 69, 70, 70, 71. Discuss the freedom value of Student's -t and 5% level of significance is 2.62.
Solve the following LPP graphically:
Minimize Z = 5x + 10y
Subject to $x+2 y \leq 120$
Constraints $\begin{aligned} x+y & \geq 60 \\ x-2 y & \geq 0\end{aligned}$
and $x, y \geq 0$
Evaluate: $\int \frac{2 x+1}{(x+1)(x-2)} d x$
The demand and supply functions for a commodity are $p = x ^2-6 x +16$ and $p =\frac{1}{3} x^2+\frac{4}{3} x+4$ respectively. Find each of the following assuming $x \leq 5$ :
i. The equilibrium point.
ii. The consumer's surplus at the equilibrium point.
iii. The producer's surplus at the equilibrium point.
A person buys a lottery ticket in 50 lotteries, in each of which his chance of winning a prize is What is the probability that he will win a prize $\frac{1}{100}$.
i. at least once
ii. exactly once
iii. at least twice?
Mr Rohit invested ₹ 5000 in a fund at the beginning of year 2021 and by the end of year 2021 his investment was worth ₹ 9000. Next year market crashed and he lost ₹ 3000 and ending up with ₹ 6000 at the end of year 2022. Next year i.e. 2023 he gained ₹ 4500 and ending up with ₹ 10500 at the end of the year. Find CAGR (Compounded Annual Growth Rate) of his investment.
$\left(\operatorname{Use}(2.1)^{1 / 3}=1.2805\right)$
The average number, in lakhs, of working days lost in strikes during each year of the period 2001-2010 was
2001200220032004200520062007200820092010
1.51.81.92.22.63.72.26.43.65.4
Calculate the three-yearly moving averages and draw the moving averages graph.