Question
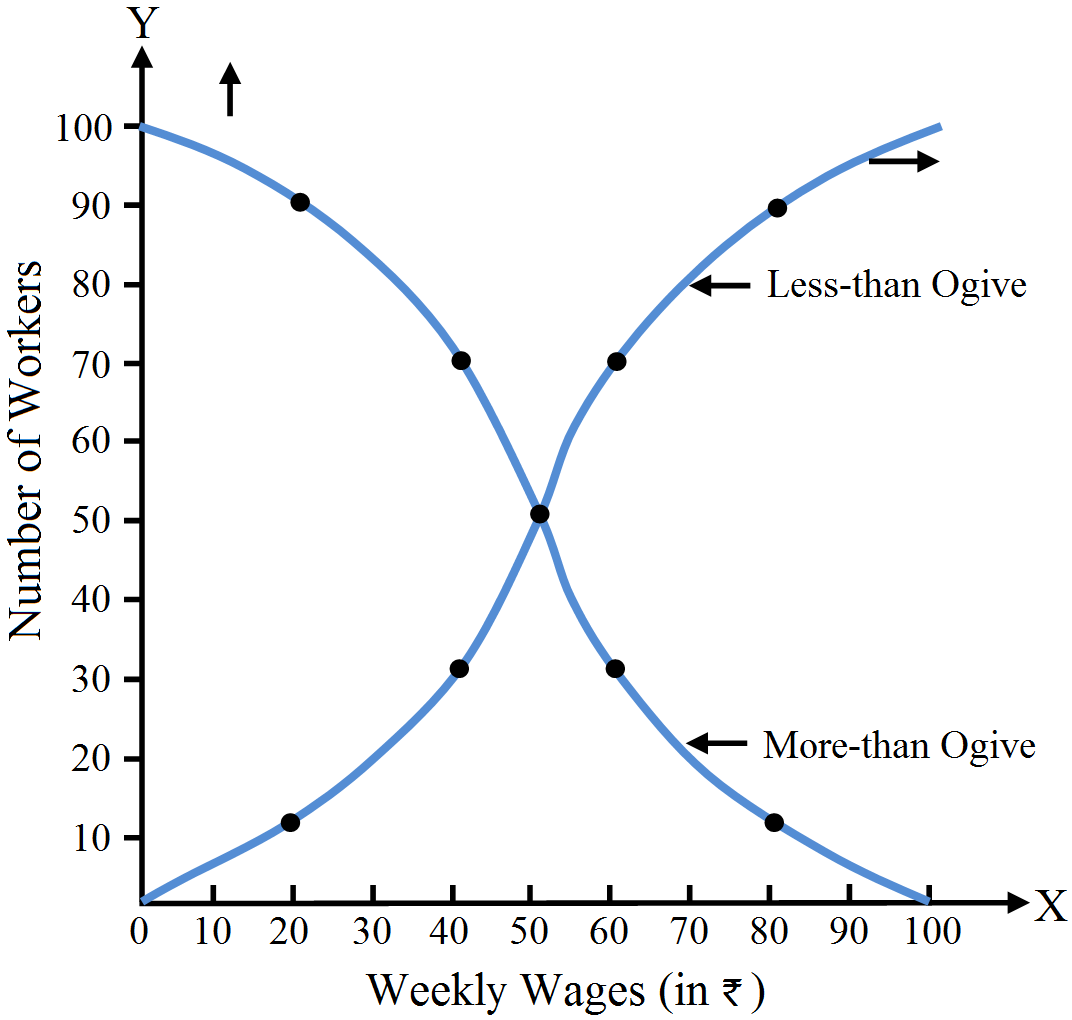
Draw the 'less-than' and 'more-than'ogive from the data given below:
Weekly Wages (in ₹)
Number of Workers
0-20
10
20-40
20
40-60
40
60-80
20
80-100
10

Answer

For less-than and more-than ogives we will have to prepare less-than and more-than frequency distributions.
Less-than Distribution
More-than Distribution
 
Weekly Wages (in ₹)
Number of Workers
Weekly Wages (in ₹)
Number of Workers
Less than 20
10
More than 10
100
Less than 40
30
More than 20
90
Less than 60
70
More than 40
70
Less than 80
90
More than 20
30
Less than 100
100
More than 10
10
The 'less-than' and ‘more-than' ogives of the given data are shown below:

Need a full question paper?

Generate a complete, print-ready paper with questions like this in minutes — across 16+ boards, with answer keys.

Start Generating Free

Similar questions

A batsman is to be selected for a cricket team. The choice is between X and Y on the basis of their scores in five previous tests which are:
X
25
85
40
80
120
Y
50
70
65
45
80
Which batsman should be selected if we want,
  1. A higher run getter.
  2. A more reliable batsman in the team?
Represent the following information through a time series graph:
Years
2012
2013
2014
2015
2016
2017
2018
Exports (in crores ₹)
300
320
400
350
360
250
450
Imaports (in crores ₹)
450
300
280
375
330
450
325
Does the lottery method always give you a random sample? Explain.
Write a short note on Index for Industrial Production.
State the phases of the law of variable proportions in terms of total physical product. Use diagram.
Calculate the demand schedule of Raju, using following table. (Assuming Market includes four buyers.)
Price (₹)Ramesh (Units)Raju (Units)Rahim (Units)Rina (Units)Market Demand (Units)
519-7632
420-10944
321-121151
222-141561
123-181974
Explain fisher's ideal index number and His discuss how far it is ideal?
Plot the time series graph for the given information:
Years
2015
2016
2017
2018
2019
Exports (₹ in '000)
50
100
120
80
40
Profit (₹ in '000)
10
40
80
50
90

Demand schedule for commodity- X of individual A and B is given in the following table. Derive the market demand schedule and market demand curve.

Price of Commodity-X (₹)Demand of A (Units)Demand of B (Units)
197
276
365
444
533
State the major steps involved in the construction of wholesale price index numbers.