Question
Draw triangle with the measures given. In the right-angled ∆STU, hypotenuse SU = 5cm and l(ST) = 4cm.
Get the step-by-step solution for this question inside the Vidyadip app.
Get the answer in the appGenerate a complete, print-ready paper with questions like this in minutes — across 16+ boards, with answer keys.
|
Year
|
2001-02
|
2002-03
|
2003-04
|
2004-05
|
2005-06
|
|
Imports (in thousand crore rupees)
|
148
|
176
|
204
|
232
|
180 |
| Month | January | February | March | April | May | June |
| Number of hours of sunshine in Aberdeen | $2$ | $3\frac14$ | $4$ | $4\frac12$ | $7\frac34$ | $8$ |
| Number of hours of sunshine in Margate | $1\frac12$ | $3$ | $3\frac12$ | $6$ | $5\frac12$ | $6\frac12$ |
|
Outcome:
|
1
|
2
|
3
|
4
|
5
|
6
|
|
Frequency:
|
21
|
9
|
14
|
23
|
18
|
15
|
|
Students:
|
Ajay
|
Bali
|
Dipti
|
Faiyaz
|
Gotika
|
Hari
|
|
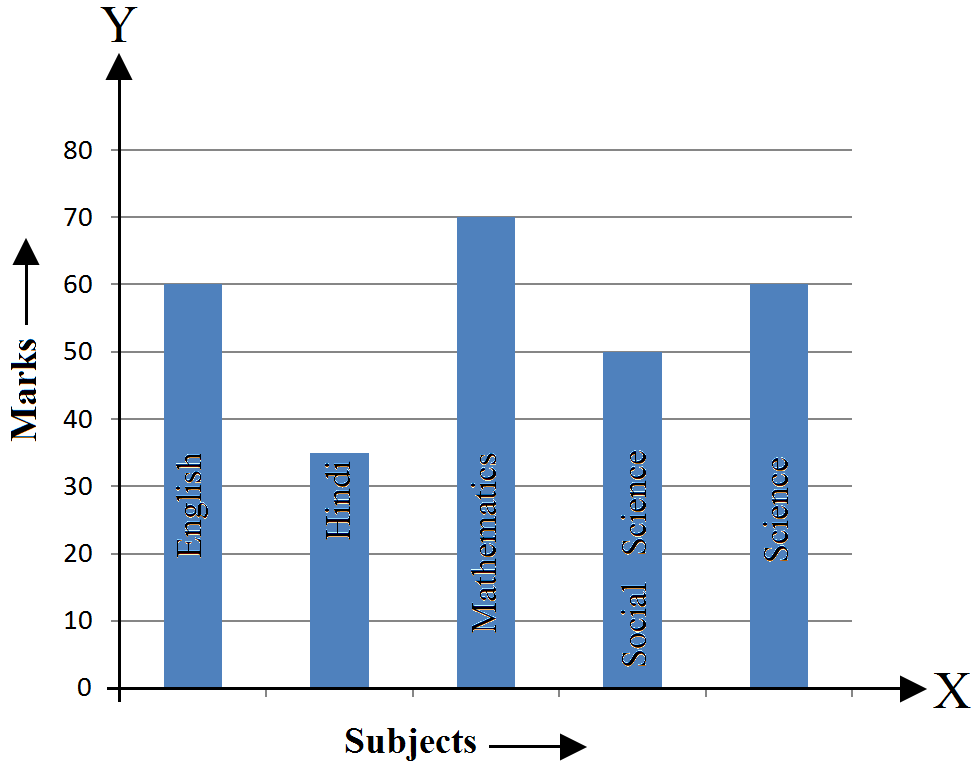
Marks Obtained:
|
450
|
500
|
300
|
360
|
400
|
540
|