Question
Explain pyramid of numbers with the help of an example.

Answer


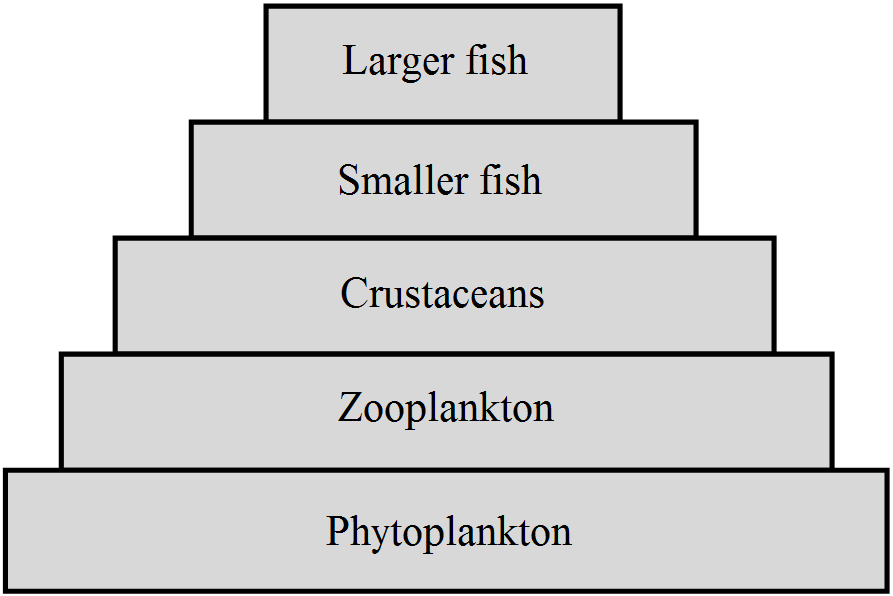
It is a graphic presentation of aquatic food chain in terms of numbers of producers and consumers at each level.

Need a full question paper?

Generate a complete, print-ready paper with questions like this in minutes — across 16+ boards, with answer keys.

Start Generating Free

Similar questions

What are the shortcomings of the graphic representation diagrams that give data of existing organisms?
  1. What do ‘Y and ‘B’ stand for in ‘YAC’ and ‘BAC’ used in Human Genome Project (HGP)? Mention their role in the project.
  2. Write the percentage of the total human genome that codes for proteins and the percentage of discovered genes whose functions are known as observed during HGP.
  3. Expand ‘SNPs’ identified by scientists in HGP.
What are different population attributes?
A cross is made between different homozygous pea plants for contrasting flower positions.
  1. Find out the position of flowers in $F_1$ generation on the basis of genotypes.
  2. Work out the cross upto $F_2$ generation.
  3. Compute the relative fraction of various genotypes in the $F_2$ generation?
Give Reasons : Human female is referred to as carrier of colour blindness.
Write a note on bleeder’s disease and its inheritance with a suitable chart.
If the meiocyte of a maize plant contains 20 chromosomes, write the number of chromosomes in the endosperm and embryo of the maize grain and give reasons in support of your answer.
  1. What is mutation breeding?
  2. Why is mutation breeding necessary?
  3. Give an example of disease-resistance developed in plant by this method.
Answer the following:
  1. What are IUDs?
  2. List out its types with examples.
  3. How do they prevent conception?
Three water samples namely river water, untreated sewage water and secondary effluent discharged from a sewage treatment plant were subjected to BOD test. The samples were labelled A, B and C; but the laboratory attendant did not note which was which. The BOD values of the three samples A, B and C were recorded as 20mg/L, 8mg/L and 400mg/L, respectively. Which sample of the water is most polluted? Can you assign the correct label to each assuming the river water is relatively clean?