Question
Explain simple bar diagram along with data and brief analysis.
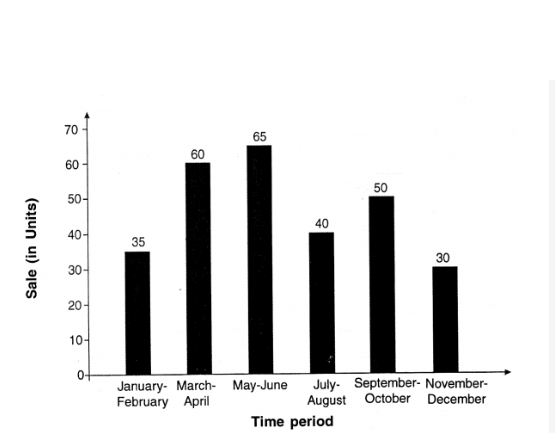
| Months | Sale in units |
| Jan-Feb | $35$ |
| Mar-Apr | $60$ |
| May-June | $65$ |
| July-Aug | $40$ |
| Sep-Oct | $50$ |
| Nov-Dec | $30$ |
Generate a complete, print-ready paper with questions like this in minutes — across 16+ boards, with answer keys.
| Sector | Investment (In%) |
| Cash money market | $41$ |
| Gilt | $3$ |
| Equity related savings plans | $1$ |
| Income / dividend | $35$ |
| Growth | $17$ |
| Balanced | $3$ |
| Total | $100$ |
| Sector | Employment | |
| China | India | |
| Agriculture | $50.0$ | $60.5$ |
| Industrial | $22.0$ | $16.8$ |
| Service | $28.0$ | $22.7$ |