Maharashtra BoardEnglish MediumSTD 11 SciencePhysicsGravitation4 Marks
Question
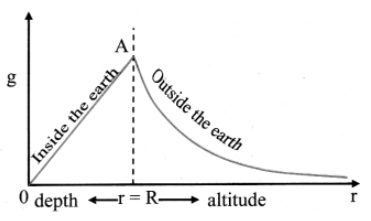
Explain the graph showing variation of acceleration due to gravity with altitude and depth.
✓
Answer
The value of acceleration due to gravity is calculated to be maximum at the surface of the Earth. The value goes on decreasing with
$i)$ increase in depth below the Earth’s surface. $[$varies linearly with $(R – d) = r]$
$ii)$ increase in height above the Earth’s surface. $[$varies inversely with $(R + h)^2 = r^2].$
Graph of $g,$ as a function of $r,$ the distance from the centre of the Earth, is plotted as shown in figure.
For $r < R ,$
$g _{ d }= g \left(1-\frac{ d }{ R }\right)$
if $r = R - d ,$
$g( r )= g \left(\frac{r}{R}\right) \Rightarrow g(r) \propto r$
Hence, the graph shows a straight line passing through origin and having slope $\frac{ g }{ R }$.
For $r>R$
$g_h=g\left[\frac{R^2}{(R+h)^2}\right] \text { if } r=R+h$
$g(r)=g \frac{R^2}{r^2}$
$\Rightarrow g(r) \propto \frac{1}{r^2}$
which is represented in the graph.
Need a full question paper?
Generate a complete, print-ready paper with questions like this in minutes — across 16+ boards, with answer keys.