Question
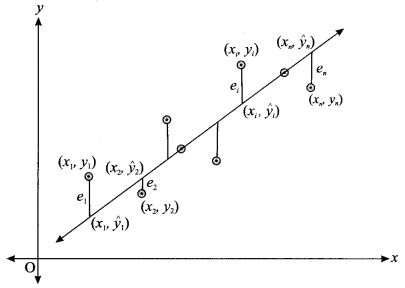
Explain the method of least square for fitting a regression line.

Answer


The best fitted regression line of $Y$ on $X$ can be obtained by this method. Suppose n ordered pairs of sample observations on two correlated variables $X$ and $Y$ are $(x_1, y_1), (x_2, y_2), …, (x_n, y_n).$ To understand the least square method we draw the scatter diagram for this data.
Image
If the equation of best fitted line showing the linear regression between $Y$ and $X$ is $ŷ = a + bx$ then the values of constants a and b can be obtained by least square method as follows:
Suppose $ŷ_1, ŷ_2, ………, ŷ_n$ are the estimated values for the values $y_1, y_2, ………. y_n$ of $Y$ obtained by the equation of line $Y$ corresponding to the values $x_1, x_2, ………., x_n$ of variable $X.$
Now, for a given value $x_1$ of $x,$ the corresponding to the value y of $y_1$ the estimated value $ŷ$ of $y$ will be $ŷ = a + bx_1.$
The values of constants a and b of the fitted line $ŷ = a + bx$ are obtained by least square method in such a way so that the sum of squares of errors $\sum e_i^2$ becomes minimum, where $(e = y – ŷ)$. Thus, $\sum e^2 = \sum (y – ŷ)^2 = \sum (y – a – bx)^2$ becomes minimum.
The line $ŷ = a + bx$ obtained passes through close to most of the points on scatter diagram. While obtaining the regression line, the sum of squares of errors is minimised, therefore it is called method of least square.

Need a full question paper?

Generate a complete, print-ready paper with questions like this in minutes — across 16+ boards, with answer keys.

Start Generating Free

Similar questions

The following data is available for the variable $y$ of a time series. Fit a linear equation from it.
$n=9, \Sigma y=214, \Sigma t y=1051$
If events $A, B$ and $C$ are independent events and $P(A) = P(B) = P(C) = p,$ then find the value of $P(A ∪ B ∪ C)$ in terms of $p.$
Obtain the regression line of Yon $X$ from the following data
$n =6, \Sigma x=1020, \Sigma y =990, \Sigma(x-170)^2=60$
$\Sigma( y -165)^2=105, \Sigma(x-170)(y-165)=45 .$
Write any six properties of normal distribution.
The chain base index numbers for sales of a certain type of scooter from the year $2015$ to $2020$ are as follows. Find fixed base index numbers.
years $2015$ $2016$ $2017$ $2018$ $2019$ $2020$
Index numbers of sale $110$ $112$ $109$ $108$ $105$ $111$
$8$ workers are employed in a factory and $3$ of them are excellent in efficiency where as the rest of them are moderate in efficiency. $2$ workers are randomly selected from these $8$ workers. Find the probability that $(1)$ both the workers have excellent efficiency $(2)$ both the workers have moderate efficiency $(3)$ one worker is excellent and one worker is moderate in efficiency.
Find the fixed base index numbers from the following data about average annual income of workers in a company from the year $2008$ to the year $2014.$ $($Take base year as $2008)$
Year $2008$ $2009$ $2010$ $2011$ $2012$ $2013$ $2014$
Average annual income $(Rs. 10,000)$ $36$ $40$ $48$ $52$ $60$ $80$ $95$
Express the following modulus form in neighbourhood form: $(1)\ |x|<1\ (2)\ |2 x-1|<2\ (3)\ |x+2|<0.5$
Random variables $X$ and $Y$ are mutually dependent variables. Following data is collected from a random sample of $10$ observations: $\Sigma x=360: \Sigma y=450 ; \operatorname{Cov}(x, y)=90 ; S_{x}=9, S_{y}=12$
A person is asked to select a number from positive integers $1$ to $7.$ If the number selected by him is odd then he is entitled to get the prize. If he is asked to take $5$ trials then find the probability of the event that he will be entitled to get a prize in only one trial.