Question
For the diode, the characteristic curves are given at different temperature. The relation between the temperatures is

|
(a) |
(b) |
(c) |
(d) None of the above |
For the diode, the characteristic curves are given at different temperature. The relation between the temperatures is
|
(a) |
(b) |
(c) |
(d) None of the above |
Generate a complete, print-ready paper with questions like this in minutes — across 16+ boards, with answer keys.
A coil of resistance 10 W and an inductance 5H is connected to a 100 volt battery. Then energy stored in the coil is
|
(a) 125 erg |
(b) 125 J |
(c) 250 erg |
(d) 250 J |
When white light passes through the achromatic combination of prisms, then what is observed
|
(a) Only deviation |
(b) Only dispersion |
|
(c) Deviation and dispersion |
(d) None of the above |
The magnitude and direction of the current in the circuit shown will be

|
(a) |
(b) |
|
(c) 1 A from b to a through e |
(d) 1 A from a to b through e |
In Young's double slit experiment, a glass plate is placed before a slit which absorbs half the intensity of light. Under this case
|
(a) The brightness of fringes decreases |
|
(b) The fringe width decreases |
|
(c) No fringes will be observed |
|
(d) The bright fringes become fainter and the dark fringes have finite light intensity |
The atomic weight of silver and copper are 108 and 64. A silver voltameter and a copper voltameter are connected in series and when current is passed 10.8 gm of silver is deposited. The mass of copper deposited will be
|
(a) 6.4 gm |
(b) 12.8 gm |
(c) 3.2 gm |
(d) 10.8 gm |
A monochromatic beam of light falls on YDSE apparatus at some angle (say q) as shown in figure. A thin sheet of glass is inserted in front of the lower slit S2. The central bright fringe (path difference = 0) will be obtained

|
(a) At O |
|
(b) Above O |
|
(c) Below O |
|
(d) Anywhere depending on angle q, thickness of plate t and refractive index of glass m |
Order of magnitude of density of uranium nucleus is (![]()
|
(a) |
(b) |
(c) |
(d) |
Orbital acceleration of electron is
|
(a) |
(b) |
(c) |
(d) |
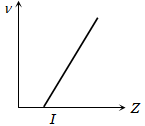
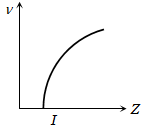
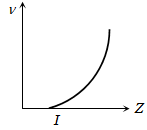
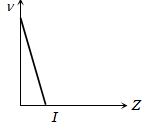
The graph that correctly represents the relation of frequency n of a particular characteristic X-ray with the atomic number Z of the material is
|
(a)
|
(b)
|
(c)
|
(d)
|