States of Matter — Chemistry STD 11 Science — Question
Maharashtra BoardEnglish MediumSTD 11 ScienceChemistryStates of Matter4 Marks
Question
Give the different graphical representation of Charles’ law.
✓
Answer
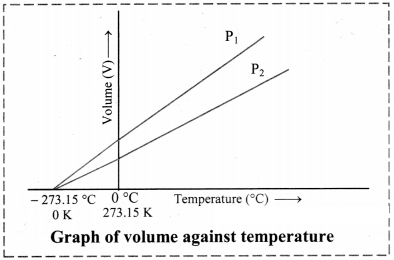
Graph of volume versus temperature at constant pressure:
According to Charles’ law, the graph of volume of a gas $($at given constant pressure, say $P_1)$ versus its temperature in Celsius, is a straight line with a positive slope.
On extending the line to zero volume, the line intercepts the temperature axis at $-273.15 ^\circ C.$
At any other value of pressure, say $P_2,$ a different straight line for the volume temperature plot is obtained, but we get the same zero$-$volume temperature intercept at $-273.15 ^\circ C.$
The straight line of the volume versus temperature graph at constant pressure is called isobar.
$[$Note: Zero volume for a gas sample is a hypothetical state. In practice, all the gases get liquified at a temperature higher than $-273.15 ^\circ C.$ This temperature is the lowest temperature that can be imagined but practically cannot be attained. It is the absolute zero temperature on the Kelvin scale $(0 K).]$
Need a full question paper?
Generate a complete, print-ready paper with questions like this in minutes — across 16+ boards, with answer keys.