Question
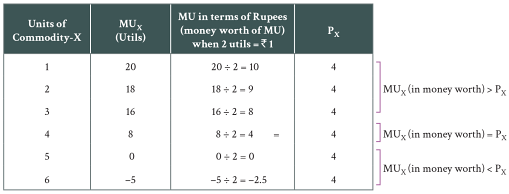
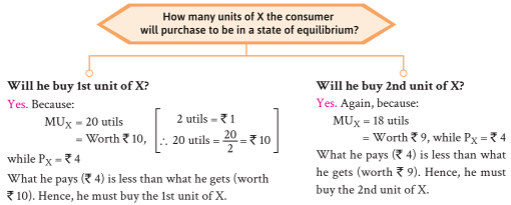
How does a consumer reach equilibrium position when he is buying only one commodity? Explain with the help of marginal utility schedule.

Answer

Now, we address the basic question of this chapter: How much of a commodity a consumer buys so that he maximises his satisfaction and attains the point of equilibrium? This is discussed with reference to two different situations:
(i) when only one commodity is consumed, and
(ii) when two or more commodities are consumed.
Following is brief description of both the situations.
Consumer's Equilibrium: One Commodity Case
Purchase of a commodity by a consumer depends on three factors:
(i) Price of the commodity.
(ii) Marginal (and total) utility of the commodity.
(iii) Marginal utility of money.
Assumptions for the illustration given below:
Let marginal utility of money for the consumer = 2 utils (referring to the utility he expects to receive when he spends ₹1).
Let X be the commodity he intends to buy.
Let $P_X$ (Price of X) = ₹4 per unit.
Marginal Utility Schedule of X is taken to be as follows:
Calculation of MU in terms of Rupees, given Marginal Utility Schedule of Commodity-X
Image
Using the scale that 2 utils₹1, MU in terms of rupees is calculated as shown above.
Now comes the basic question: How many units of X the consumer will purchase to be in a state of equilibrium?
Image

Continuing like this, he will stop buying X, only when:
$MU _{ x }$(in terms of rupees) = $P _{ X }$
It occurs when the consumer buys 4 units of commodity-X. Here,
$MU _{ x }$(in terms of rupees) = $P _{ X }$= ₹4

Need a full question paper?

Generate a complete, print-ready paper with questions like this in minutes — across 16+ boards, with answer keys.

Start Generating Free

Similar questions

Differentiate between quantitative and qualitative classification.
Giving reasons, Identify the equilibrium level of output and find profit at this output using Marginal Cost and Marginal Revenue approach from the following table:
Output (units)12345
Total Revenue (Rs.)1020304050
Total Cost (Rs.)1222304052
From the following data, construct a weighted index number for $2010$ with $2000$ as base year:
Items Weight Prices
2000 2010
Wheat 15 10 15
Rice 10 8 16
Pulses 5 5 10
Milk 4 2 4
Oil 6 4 6
Sugar 7 3 6
Salt 3 1 2
Represent the following data with the help of multiple bar diagram.
Year
2003
2004
2005
2006
Exports (crore in ₹)
73
80
85
80
Imports (crore in ₹)
70
72
75
85
What is meant by price elasticity of demand? How is it measured?
Explain the relation between marginal cost and average cost.
Or
Explain the relationship between marginal cost and average cost with the help of a cost schedule.
Given the following data:
Year
1995-96
1996-97
1997-98
1998-99
1999-2000
2000-01
2001-02
2002-03
WPI (1993-94)
121.6
127.2
132.8
140.7
145.7
155.7
161.3
166.8
Calculate the inflation rate and interpret the result.
What are the characteristics of an index number?
The following table shows the total cost schedule for a competitive firm. It is given that the price of the good is ₹ 10. Calculate the profit at each output level. Find the profit-maximizing level of output.
OutputTC (₹)
05
115
222
327
431
538
649
763
881
9101
10123
As a result of $10$ per cent fall in price of a good, its demand rises from $100$ units to $120$ units. Find out the price elasticity of demand.