Question
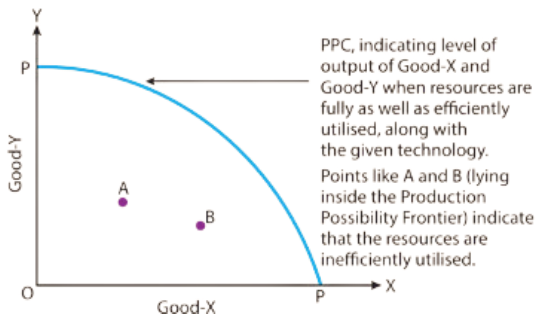
How is production possibility frontier affected when resources are inefficiently employed in an economy?
Generate a complete, print-ready paper with questions like this in minutes — across 16+ boards, with answer keys.
Demand schedule for commodity- X of individual A and B is given in the following table. Derive the market demand schedule and market demand curve.
| Price of Commodity-X (₹) | Demand of A (Units) | Demand of B (Units) |
| 1 | 9 | 7 |
| 2 | 7 | 6 |
| 3 | 6 | 5 |
| 4 | 4 | 4 |
| 5 | 3 | 3 |
| Size: | 5-10 | 10-15 | 15-20 | 20-25 | 25-30 |
| Frequency: | 4 | 9 | 15 | 30 | 40 |
| Output (Units) | Price (₹) | Total Revenue (₹) | Marginal Revenue (₹) |
| 1 | — | 6 | — |
| 2 | — | — | 2 |
| 3 | — | — | -2 |
| 4 | — | — | -2 |