Question
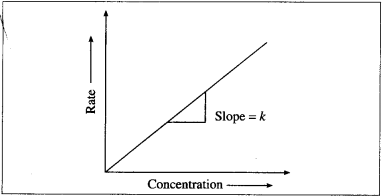
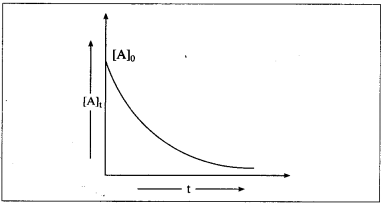
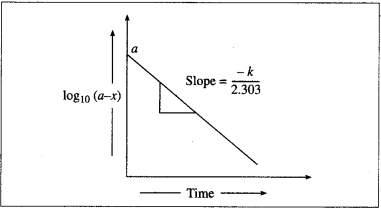
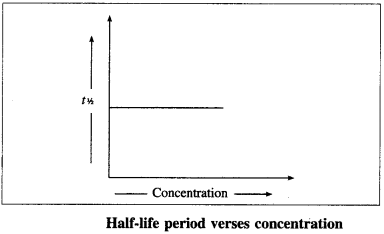
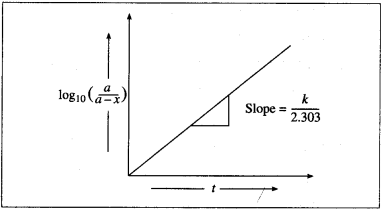
How will you represent first-order reactions graphically.

Answer

(1) A graph of rate of a reaction and concentra­tion : The differential rate law for first-order reac­tion, $A \rightarrow $ Products is represented as, Rate = $
latex-\frac{d[\mathrm{~A}]}{d t}=k[\mathrm{~A}]$
$\therefore $ Rate $= k x [A]_t$ (y = mx). When the rate of a first order reaction is plotted against concentration,$[A]_t$​​​​​​​, a straight line graph is obtained.
With the increase in the concentration $[A]_t$​​​​​​​, rate R, increases. The slope of the line gives the value of rate constant k.
Image
(2) A graph of concentration against time : When the concentration of the reactant is plotted against time t, a curve is obtained. The concentration $[A]$, of the reactant decreases exponentially with time. The variation in the concentration can be represented as,$[ A ]_t=[ A ]_0\ e ^{-k t}$
Image
where $[A]_0$​​​​​​​ and $[A]_t​​​​​​​$​​​​​​​ are initial and final concentra­tions the reactant and k is the rate constant. The time required to complete the first order reaction is infinity.
(3) A graph of $log_{10} (a – x)$ against time t :
$k=\frac{2.303}{t} \log _{10}\left(\frac{a}{a-x}\right)$
$\therefore k=\frac{2.303}{t}\left[\log _{10} a-\log _{10}(a-x)\right]$
$\therefore \frac{k}{2.303} \times t=\log _{10} a-\log _{10}(a-x)$
$\therefore \log _{10}(a-x)$
$=-\frac{k}{2.303} \times t+\log _{10} a(y=-m x+c)$
Image
When $log_{10}(a – x)$ is plotted against time t, a straight line with negative slope is obtained, from which the velocity constant k can be calculated.
(4) A graph of half-life period and concentration : The half-life period, $t_{1/2}$​​​​​​​ of a first order reaction is given by, where k is the rate constant.
For the given reaction at a constant temperature, $t_{1/2}$​​​​​​​ is constant and independent of the concentration of the reactant.
Hence when a graph of $t_{1/2}$​​​​​​​ is plotted against concentration, a straight line parallel to the concen­tration axis (slope = zero) is obtained.
Image
(5) A graph of $log_{10} [latex]\left(\frac{a}{a-x}\right)$ against time : The rate constant, for a first order reaction is represented as,
$k=\frac{2.303}{t} \log _{10}\left(\frac{a}{a-x}\right)=\frac{2.303}{t} \log _{10} \frac{\left[ A _0\right]}{[ A ]_t}$ where $\left[ A _0\right]$ and $[ A ]_{ t }$ are the respective initial and final concentrations of the reactant after time $t$.
$\therefore \log \left(\frac{a}{a-x}\right)=\frac{k}{2.303} \times t(y=m x)$
Image
When $\log _{10}\left(\frac{a}{a-x}\right)$ is plotted against time t, a straight line graph passing through the origin is obtained and the slope gives the value of $k / 2.303$. From this slope, the rate constant can be calculated.

Need a full question paper?

Generate a complete, print-ready paper with questions like this in minutes — across 16+ boards, with answer keys.

Start Generating Free