Question
Image

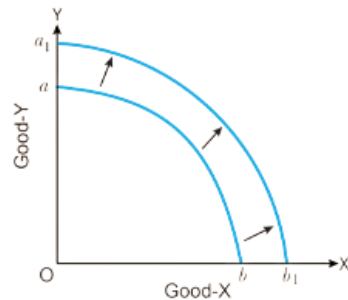
Identify the change (shift or rotation) in PPC as shown in the image given above and state its causes.

Answer

The above image shows shift in PPC to the right. PPC (production possibility curve) is a curve showing different possible combinations of a set of two goods which can be produced with the given resources and given technology.
PPC shifts to the right due to the following reasons:
(i) Growth of Resources: Growth of resources would lead to growth of potential output, we can produce more of both the goods. Accordingly, PPC shifts to the right (from ab to a,b, as shown in the above diagram).
(ii) Technological Advancement: Technological advancement shifts the PPC to the right (from ab to a,b,), because better technology means more can be produced with the given resources.

Need a full question paper?

Generate a complete, print-ready paper with questions like this in minutes — across 16+ boards, with answer keys.

Start Generating Free

Similar questions

Given below is a cost and revenue schedule of a producer. At what level of output is the producer in equilibrium? Give reasons for your answer.
Output (Units)Total Revenue (₹)Marginal Cost (₹)
11514
21624
31730
41851
51975
What will be the effect of $10$ per cent rise in price of a good on its demand if price elasticity of demand is $(a)$ zero, $(b) -1, (c)-2?$
Explain the role of statistics in economic planning.
'In India, retail price of petrol has significantly fallen during the past six months. But, demand for cars has not shown any significant rise.'
Use your economics to explain this fact.
What are different types of errors in collection of data?
For a commodity, $\frac{\Delta P }{ P }=-0.2$, and elasticity of demand = -0.5. Find quantity demanded after a fall in price when initially it was 60 units.
Why are '+' and '-' signs ignored while taking deviations from mean or median?

Demand schedule for three consumers such as Mohan, Rohan and Mitu for a commodity is given below. Derive the market demand schedule.

Price (₹)Demand Schedule of Mohan (Units)Demand Schedule of Rohan (Units)Demand Schedule of Mitu (Units)
1605524
2504013
340255
430100
52000
The following table gives the total product schedule of labour. Find the corresponding average product and marginal product schedules of labour.
L012345
TP<sub>L</sub>01535504048
A consumer spends ₹60 on a good priced at ₹5 per unit. When price falls by 20 per cent, the consumer continues to spend ₹60 on the good. Calculate price elasticity of demand by percentage method.