Question
In the figures below, find the value of ‘x’.
Image

Answer

i. In ∆LMN, ∠M = 90°.
Hence, side LN is the hypotenuse.
According to Pythagoras’ theorem,
l(LN)² = l(LM)² + l(MN)²
∴ x² = 72 + 24²
∴ x² = 49 + 576
∴ x² = 625
∴ x² = 25²
∴ x = 25 units

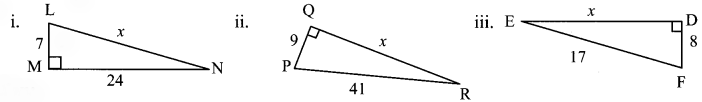
ii. In ∆PQR, ∠Q = 90°.
Hence, side PR is the hypotenuse.
According to Pythagoras’ theorem,
l(PR)² = l(PQ)² + l(QR)²
∴ 412 = 92 + x²
∴ 1681 = 81 + x²
∴ 1681 – 81 = x²
∴ 1600 = x²
∴ x² = 1600
∴ x² = 40²
∴ x = 40 units

iii. In AEDF, ∠D = 90°.
Hence, side EF is the hypotenuse.
According to Pythagoras’ theorem,
l(EF)² = l(ED)² + l(DF)²
∴ 17² = x² + 8²
∴ 289 = x² + 64
∴ 289 – 64 = x²
∴ 225 = x²
∴ x² = 225
∴ x² = 15²
∴ x = 15 units

Need a full question paper?

Generate a complete, print-ready paper with questions like this in minutes — across 16+ boards, with answer keys.

Start Generating Free

Similar questions

Suman studies for $5\frac{2}{3}$ hours daily. She devotes $2\frac{4}{5}$ hours of her time lor Science and Mathematics. How much time does she devote for other subjects?
In a public library, the librarian made the following observations in a particular week.
Days
Mon.
Tues.
Wed.
Thurs.
Fri.
Sat.
Newspaper readers
350
400
500
450
550
450
Magazine readers
200
450
300
250
100
50
  1. Draw a double bar graph choosing an appropriate scale.
  2. On which day, the number of readers in the library was maximum?
  3. What is the mean number of magazine readers per day?
The height of 30 children in a class is given in centimeters. Draw up a frequency table of this data.
131, 135, 140, 138, 132, 133, 135, 133, 134, 135, 132, 133, 140, 139, 132, 131, 134, 133, 140, 140, 139, 136, 137, 136, 139, 137, 133, 134, 131, 140
The following data gives the amount of manure (in thousand tonnes) manufactured by a company during some years:
Year 1992 1993 1994 1995 1996 1997
Manure (in thousand tonnes) 15 35 45 30 40 20
Represent the above data with the help of a bar graph.
  1. Indicate with the help of the bar graph the year in which the amount of manure manufactured by the company was maximum.
  2. Choose the correct alternative:
The consecutive years during which there was maximum decrease in manure production are:
  1. 1994 and 1995
  2. 1996 and 1997
  3. 1992 and 1993
  4. 1995 and 1996
Saritaben, Ayesha and Meenakshi started a business by investing Rs 2400, Rs 5200 and Rs 3400. They made a profit of 50%. If they reinvested all their profit by adding it to the capital, find out the proportions of their shares in the capital during the following year.
Multiply the given integers and complete the table given below.
Image
Consider the data, showing the average daily hours of sunshine in two cities Aberdeen and Margate for six months of an year.
Month January February March April May June
Number of hours of sunshine in Aberdeen $2$ $3\frac14$ $4$ $4\frac12$ $7\frac34$ $8$
Number of hours of sunshine in Margate $1\frac12$ $3$ $3\frac12$ $6$ $5\frac12$ $6\frac12$
Draw a double bar graph, to depict the above information:
  1. In which month does Aberdeen have maximum sunlight?
  2. In which month does Margate have minimum sunlight?
Draw the pairs of angles as described below. If that is not possible, say why.
i. Complementary angles that are not adjacent.
ii. Angles in a linear pair which are not supplementary.
iii. Complementary angles that do not form a linear pair.
iv. Adjacent angles which are not in linear pair.
v. Angles which are neither complementary nor adjacent.
vi. Angles in a linear pair which are complementary.
The following table shows the interest paid by India (in thousand crore rupees) on external debts during the period 1998-99 to 2002-03. Represent the data by a bar graph.
Year
1998-99
1999-2000
2000-01
2001-02
2002-03
Interest (in thousand crore rupees)
70
84
98
106
120
Arrange the following fractions in ascending order:
$\frac{4}{6},\frac{3}{8},\frac{6}{12},\frac{5}{16}$