Question
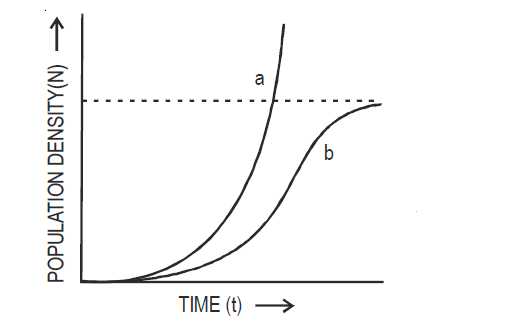
  1. Name the two growth models that represent population growth and draw the respective growth curves they represent.
  2. State the basis for the difference in the shape of these curves.
  3. Which one of the curves represents the human population growth at present? Do you think such a curve is sustainable ? Give reason in support of your answer.

Answer

  1. Exponential growth curve , logistics growth curve -

a - Exponential growth curve b - logistic growth curve.

  1. Exponential growth - food resources and space unlimited.

Logistic growth - food resources and space limited.

  1. Exponential growth.

Not sustainable, as resources are limited/carrying capacity.

Need a full question paper?

Generate a complete, print-ready paper with questions like this in minutes — across 16+ boards, with answer keys.

Start Generating Free

Similar questions

  1. Explain the differences and similarities between hydrarch and xerarch successions of plants.
  2. Mention the role of living organisms in the phosphorus cycle.
What is innate immunity? How is it accomplished in a human body?
Draw the structure of HIV virus of AIDS and give its transmission, symptoms and treatment.
OR
Draw a labeled picture of HIV. Describe its structure.
Write the differences in following-
(a) Humoral Immunity and cell mediated Immunity.
(b) Innate Immunity and acquired Immunity
(c) Antigens and antibody
(d) T-lymphocytes and B-lymphocytes
Differentiate between:
  1. Predator and parasite.
  2. S-Shaped and J-Shaped growth curve.
Enumerate the role of microbes in producing some household products.
B. In the future, genetic therapies may be used to prevent, treat, or cure certain inherited disorders in humans. Justify the statement with a suitable example.
Mention their source and the function they perform:
hCG, LH, FSH, Relaxin.
Study the 3 representative figures of age pyramid relating to human population given below and answer the following question:

  1. Mention the names given to the 3 kinds of age profiles (i), (ii), and (iii).
  2. Which one of them is ideal for a population and why?
  3. How do such age-profile studies help policy makers get concerned about our growing population and prepare for future planning? (say for example: for the year 2022.)
[Hint. The age profile you would name as stable was prepared on the data available on January 2007].
Explain the surgical method of contraception with the help of a labelled diagram.###Write the name of a surgical contraceptive method and explain it which can be adopted by the male member of the couple.