Question
Observe the following graphs and answer the questions.
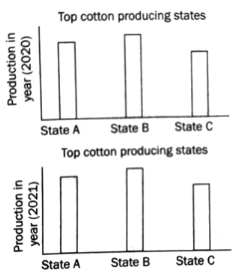
What could be the possible reason behind the varied production of cotton in state 'C' from year 2020 to 2021 ?
What could be the possible reason behind the varied production of cotton in state 'C' from year 2020 to 2021 ?