Question
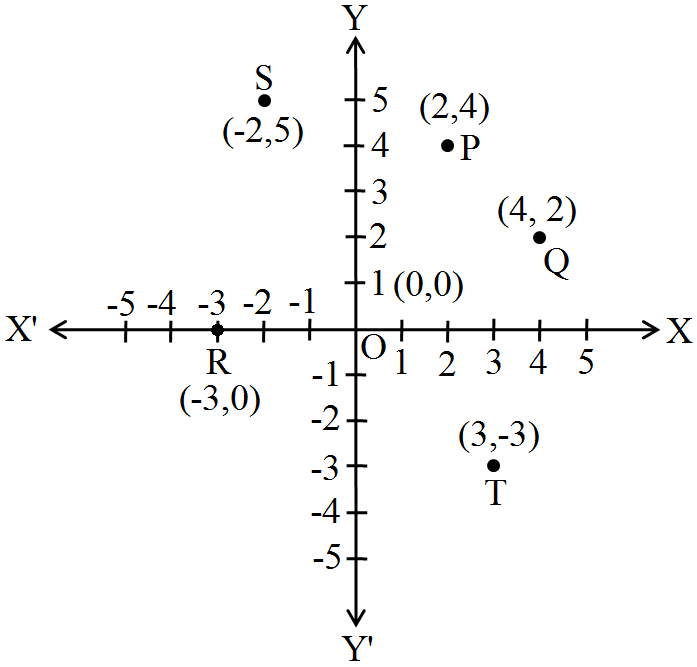
Plot the points (x, y) given by the following table:
x
2
4
-3
-2
3
0
y
4
2
0
5
-3
0

Answer

On plotting the given points on the graph, we get the points P(2, 4), Q(4, 2), R(-3, 0), S(-2, 5), T(3, -3)and O(0, 0).

Need a full question paper?

Generate a complete, print-ready paper with questions like this in minutes — across 16+ boards, with answer keys.

Start Generating Free