Question
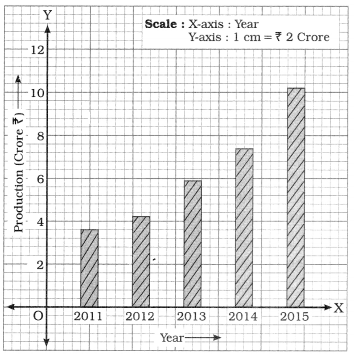
Represent the following data through a bar diagram :
| Year | $2011$ | $2012$ | $2013$ | $2014$ | $2015$ |
| Production(in crore) | $3.5$ | $4.2$ | $5.8$ | $7.4$ | $10.2$ |