MCQ
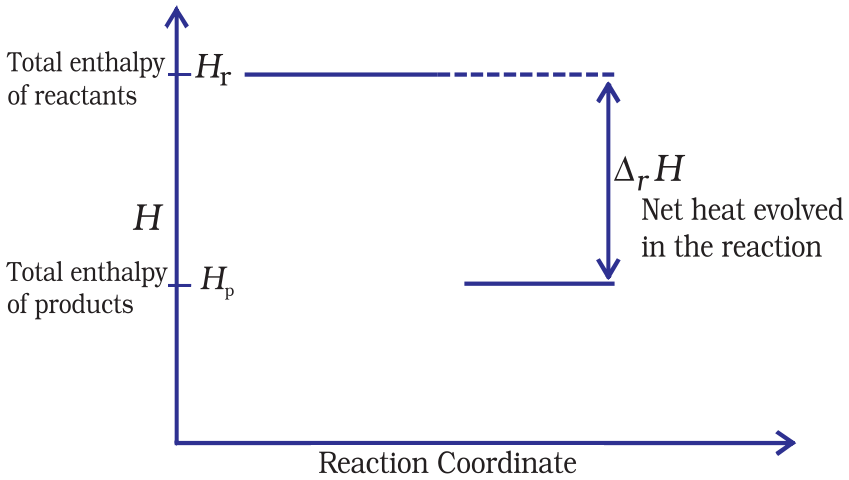
The above diagram represents:
- AEnthalpy for exothermic reactions.
- BEnthalpy for endothermic reactions.
- CEntropy for exothermic reactions.
- DEntropy for endothermic reactions.
The above diagram represents:
Explanation:
In an exothermic reaction, there is the decrease in enthalpy on passing from reactants to products.
Generate a complete, print-ready paper with questions like this in minutes — across 16+ boards, with answer keys.
| List $I$ (Fuels) | List $II$ (Composition) |
| $A.$ Water gas | $i.$ A mixture of $CO$ and $N_2$ |
| $B.$ Producer gas | $ii.$ Methane |
| $C.$ Coal gas | $iii.$ A mixture of $CO$ and $H_2$ |
| $D.$ Natural gas | $iv.$ A mixture of $CO$, $H_2$, $CH_4$ and $CO_2$ |
$A\,-\,B\,-\,C\,-\,D$ Respectively