MCQ
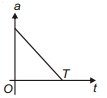
The acceleration (a)-time $(t)$ graph for a particle moving along a straight starting from rest is shown in figure. Which of the following graph is the best representation of variation of its velocity $(v)$ with time $(t)$ ?
- ✓

- B

- C

- D

From the graph it is evident that the acceleration is decreasing with time.
Also, $a \propto-t$
$\Rightarrow a=-k t \quad$ (decreasing with time)
To find velocity,
$\frac{d v}{d t}=-k t$
$\int d v=\int-k t d t$
$v \propto-t^2$ or graph of velocity should be parabolic with a decreasing slope.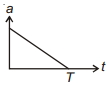
Generate a complete, print-ready paper with questions like this in minutes — across 16+ boards, with answer keys.