MCQ
The following graph represents the inequality.
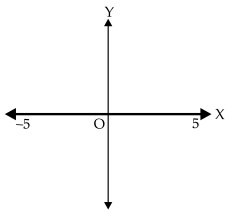
- A$x > - 5$
- B$x < 5$
- ✓$|x| < 5$
- D$|x| < - 5$
Generate a complete, print-ready paper with questions like this in minutes — across 16+ boards, with answer keys.
| Year-End | 31-12-2018 | 31-12-2021 |
| Year-End Revenue | 9,000 | 13,000 |