Question
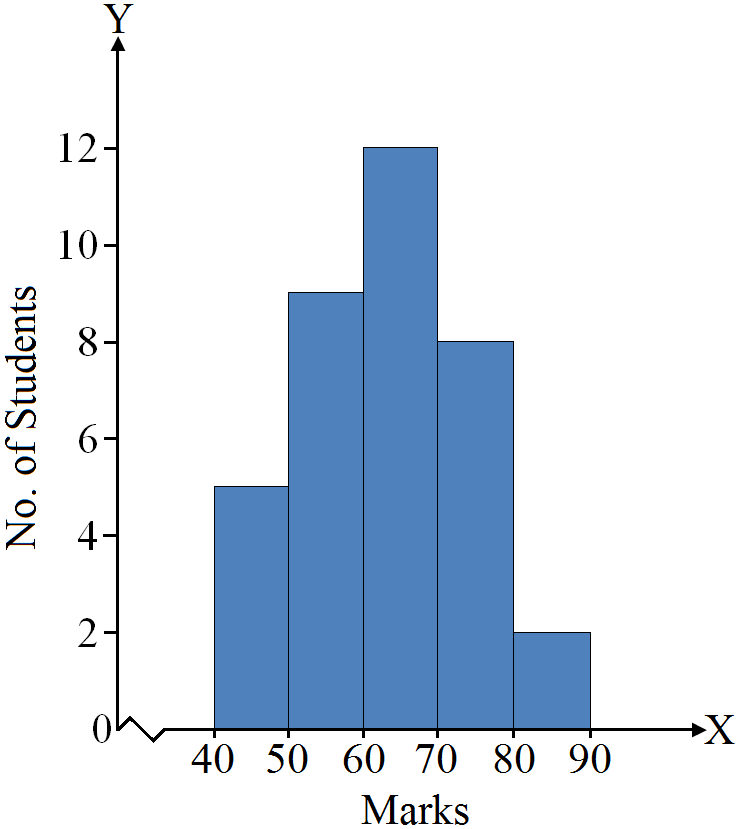
The frequency distribution of marks obtained by students in a class test is given below:
Marks (Midpoints)
45
55
65
75
85
No. of Students
5
9
12
8
2
Draw a Histogram from the above distribution.

Answer

Histogram
Marks (Midpoints)
40-50
50-60
60-70
70-80
80-90
No. of Students (f)
5
9
12
8
2

Need a full question paper?

Generate a complete, print-ready paper with questions like this in minutes — across 16+ boards, with answer keys.

Start Generating Free

Similar questions

Draw a scatter diagram of the following data and interpret to find the nature of correlation.
X
2
3
5
6
8
9
Y
6
5
7
8
12
11
Draw pie diagram to represent the following information of expenditure by a family:
Items of Expenditure Food Education Housing Clothing Miscellaneous
% age of total expenditure 60 15 10 10 5
Answer the following questions
(i) If a product price increases, a family's spending on the product has to increase. Defend or refute.
(ii) The demand for a good double due to 25% fall in its price. Calculate its price elasticity of demand
The yield of wheat and rice per acre for $10$ districts of a state is as under:
District
1
2
3
4
5
6
7
8
9
10
Wheat
12
10
15
19
21
16
18
9
25
10
Rice
22
29
12
23
18
15
12
34
18
12
Calculate for crop.
Q.D.
Calculate Laspeyre’s and Paasche's price index numbers on the basis of the following data:
Commodity
A
B
C
D
E
Base Year Price ($p_0)$
10
25
30
15
20
Current Year Price ($p_1)$
15
40
45
30
25
Base Year Quantity $(q_0)$
6
10
15
20
8
Current Year Quantity $(q_1)$
8
20
12
15
6
What is total cost, average cost and marginal cost? Explain the relationship between average cost and marginal cost with the help of a table and diagram.
Calculate mean deviation from mean $(\text{M.D.}_{\bar{\text{X}}})$ from the given data:
Marks obtained: 140-150 150-160 160-170 170-180 180-190 190-200
No. of girls: 4 6 10 18 9 3
From the following data, relating to weights of 40 students in kg138, 164, 150, 131, 144, 125, 149, 157, 146, 148, 140, 147, 136, 148, 152, 144, 168, 126, 138, 176, 163, 119, 150, 165, 146, 173, 142, 147, 135, 153, 142, 135, 140, 135, 161, 145, 150, 156, 145, 128
  1. Obtain the range of weights of the students.
  2. Divide the range into appropriate number of class interval and obtain the frequency distribution.
  3. Find the number of students whose weight is.
  1. less than 145 kg.
  2. more than 155 kg.
  3. between 135 and 155 kg.
In a city 45 families were surveyed for the number of Cell phones they used. Prepare a frequency array based on their replies as recorded below.
1
3
2
2
2
2
1
2
1
2
2
3
3
3
3
3
3
2
3
2
2
6
1
6
2
1
5
1
5
3
2
4
2
7
4
2
4
3
4
2
0
3
1
4
3
Calculate Karl Pearson's coefficient of correlation for the data given below:
X
$2$
$3$
$4$
$5$
$6$
$7$
$8$
Y
$4$
$7$
$8$
$9$
$10$
$14$
$18$