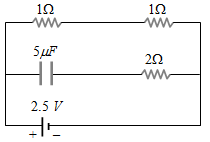
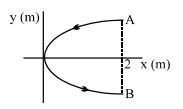
MCQ
The graph which represents the correct variation of logarithm of activity (log A) versus time, in figure is
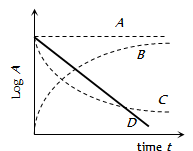
- AA
- BB
- CC
- ✓D
Generate a complete, print-ready paper with questions like this in minutes — across 16+ boards, with answer keys.
(Where the symbols have their usual meanings)