MCQ
The voltage V and current I graph for a conductor at two different temperatures $\mathrm T_1$ and $\mathrm T_2$ are shown in the figure. The relation between $\mathrm T_1$ and $\mathrm T_2$ is
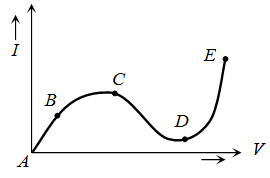
- ✓$\mathrm{T}_1>\mathrm{T}_2$
- B$\mathrm{T}_1 \approx \mathrm{T}_2$
- C$\mathrm{T}_1=\mathrm{T}_2$
- D$\mathrm{T}_1<\mathrm{T}_2$