Question
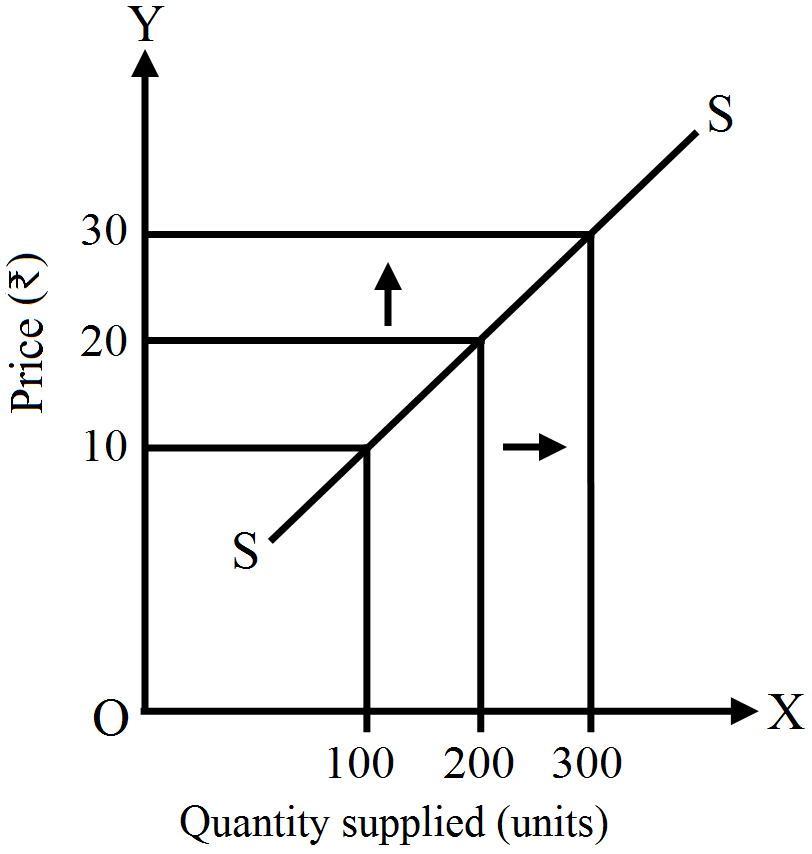
Using diagram and schedule, explain the Law of Supply
|
S. No.
|
Price (₹)
|
Quantity supplied (units)
|
|
i.
|
10
|
100
|
|
ii.
|
20
|
200
|
|
iii.
|
30
|
300
|
Generate a complete, print-ready paper with questions like this in minutes — across 16+ boards, with answer keys.
| Price (₹) | $8$ | $6$ | $4$ | $2$ |
| Output (Units) | $1$ | $2$ | $3$ | $4$ |
| TR(₹) | - | - | - | - |
| MR (₹) | - | - | - | - |
|
Total Output
(Units)
|
Total Cost (Rs)
|
|
0
|
120
|
|
1
|
180
|
|
2
|
200
|
|
3
|
210
|
|
4
|
230
|
|
5
|
270
|
|
6
|
360
|
|
Output
|
1
|
2
|
3
|
|
MC
|
10
|
20
|
15
|
|
AVC (₹)
|
-
|
-
|
-
|