Question
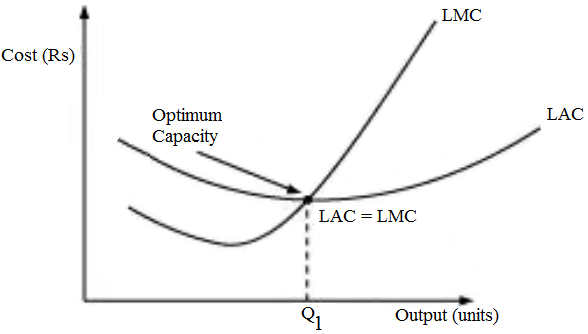
What do the long run marginal cost and the average cost curves look like?
Generate a complete, print-ready paper with questions like this in minutes — across 16+ boards, with answer keys.
| Quantity | 1 | 2 | 3 | 4 | 5 | 6 | 7 | 8 | 9 | 10 |
| Price | 100 | 90 | 80 | 70 | 60 | 50 | 40 | 30 | 20 | 10 |
| Option | Goats | Cows |
| I | 188 | 64 |
| II | 170 | 70 |