Question
With the help of given statistical data, prepare a simple bar graph and answer the following questions:
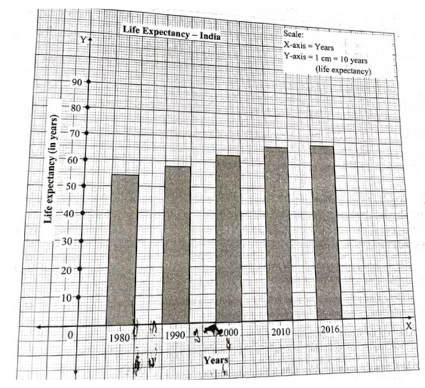
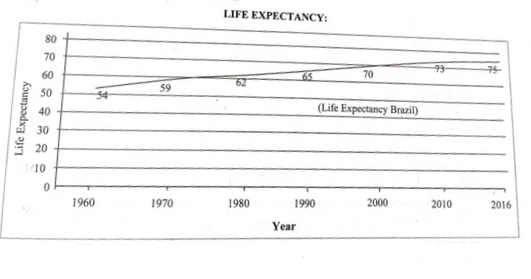
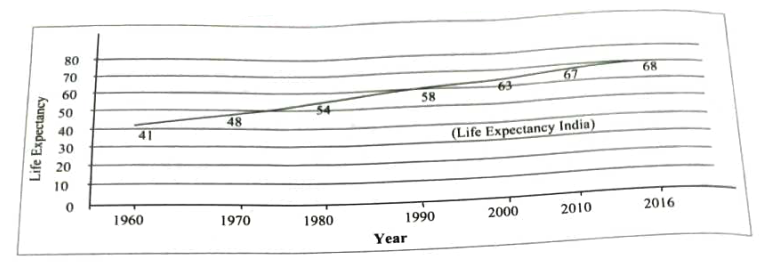
Life Expectancy - India
YearsLife Expectancy
198054
199058
200063
201067
201668
Questions:
1. In the year 1990 what is the average life expectancy?
2. In which two decades, the average life expectancy is found to be similar increase?
3. How much increase can be seen in the life expectancy from 1990 to 2016?

Answer


Image

1. In the year 1990, the average life expectancy is 58 years.
2. In the decades of 1980 to 1990 and 2000 to 2010 , the average life expectancy is found to be of similar (by 4 years) increase.
3. From 1990 to 2016 , the life expectancy increased by 10 years.

Need a full question paper?

Generate a complete, print-ready paper with questions like this in minutes — across 16+ boards, with answer keys.

Start Generating Free

Similar questions

Prepare a simple bar graph with the help of given statistical information and answer the questions given below-

Brazil-life expectancy

Years Life expectancy
1960 54
1970 59
1980 61
1990 65
2000 70
2010 73
2016 75

Questions-

  1. What is the interval of years in the data?
  2. What is the difference in life expectancy of 1960 and 2016?
  3. Write five sentences about the analysis of graph.
Prepare a simple bar graph with the help of given statistical information and answer the questions given below-

Export of India to Brazil (million US dollars)

Year Export
2008 3700
2009 2200
2010 4200
2011 6100
2012 5000

Questions-

  1. How much export was found in 2008?
  2. In which year highest export of India was found?
  3. How much export increased in millions between 2009 and 2011?
Prepare a line graph with the help of given statistical information and answer the questions given below-

India-trends of urbanization(%)

Year India
1961 18.0
1971 18.2
1981 23.3
1991 25.7
2001 27.8
2011 31.2

Questions-

  1. In which year 18% urbanization is found?
  2. Urbanization has increased by how many percent from 2001 to 2011?
  3. In which decade was the growth of urbanization highest?
Observe the following graph and answer the questions given below-

  1. Which country has a higher percent of the population engaged in primary activities?
  2. In which country is the contribution of tertiary sector greater in the GDP?
  3. In which country is the share of secondary activities more in the GDP?
  4. Can we say that Brazil is an agrarian economy like India? Give reasons.
  5. Which country has a higher percent of the population engaged in secondary activities?
  6. How muchpercent of population is engaged in tertiary activities in India?
Observe the following graph and answer the questions given below-

Brazil- % of population (2016)


  1. Which type of graph is this?
  2. Which age group has the highest population?
  3. Write class interval of age groups given on Y-axis.
  4. Whose number is more in males and females of age above 60?
  5. How much percent of females are found in age group of 55 to 59 years?
  6. After which age group is the decrease in population found?
Observe the following graph and answer the questions given below-

India- % of population (2016)

  1. Which type of graph is this?
  2. Which age group has the highest population?
  3. Write class interval of age groups given on Y-axis.
  4. Whose number is more in males and females of age above 60?
  5. How much percent of females are found in age group of 55 to 59 years?
  6. After which age group is the decrease in population found?