Question
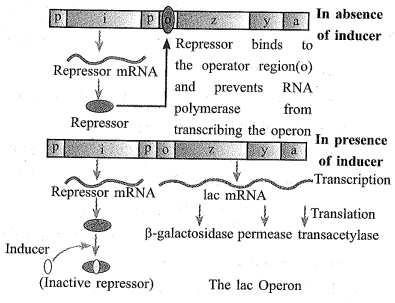
Write a note Lac operon
Generate a complete, print-ready paper with questions like this in minutes — across 16+ boards, with answer keys.
| Amino acid | mRNA triplet |
| Phenylalanine | UUU |
| Lysine | AAG |
| Arginine | CGA |
| Alanine | GCA |
| Synthetic mRNA used | Polypeptide produced |
| UUUAAAUUUAAA | Phenylalanine-Iysine-phenylalanine-Iysine |
What are the DNA codes for the amino acids phenylalanine and lysine?
| S.no | Phenylalanine | Lysine |
| (a) | AAA | TTT |
| (b) | AAA | UUU |
| (c) | GGG | CCC |
| (d) | TTT | GGG |
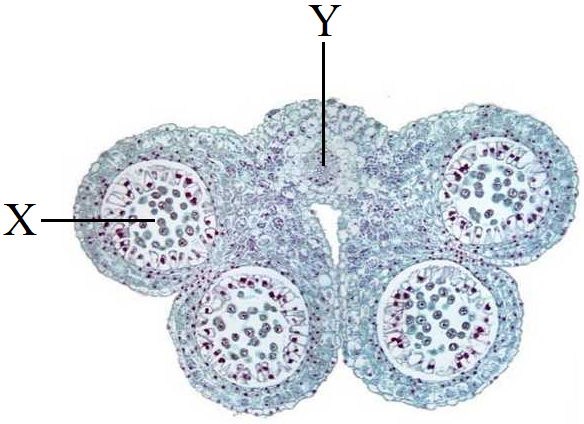
| S. No | Structure of X | Stamens |
| (a) | Abundant and light | Pendulous |
| (b) | Rough surfaces | Non-pendulous |
| (c) | Light and sticky | Pendulous |
| (d) | Coarse and sticky | Protrude outside the flower |
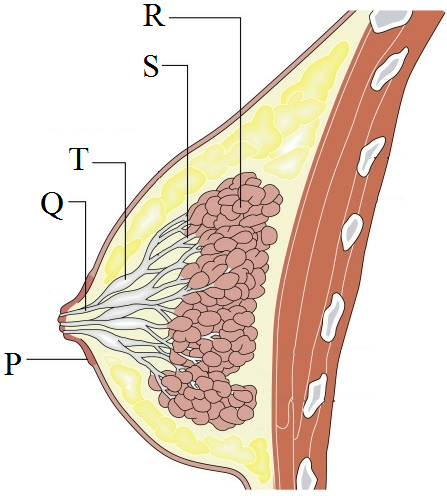
Reason: The adipose tissue supports the alveoli and the ducts.
| Area and number of habitats | Species and their population (in thousands) in the area | |||||||||
| A | B | C | D | E | F | G | H | I | J | |
| I(11) | 23 | 12 | 0.52 | 6.0 | - | 3.1 | 1.1 | 9.0 | - | 10.3 |
| II(11) | 10.2 | - | 0.62 | - | 1.5 | 3.0 | - | 8.2 | 1.1 | 11.2 |
| III(13) | 11.3 | 0.9 | 0.48 | 2.4 | 1.4 | 4.2 | 0.8 | 8.4 | 2.2 | 4.1 |
| IV(12) | 3.2 | 10.2 | 1.1 | 4.8 | 0.4 | 3.3 | 0.8 | 7.3 | 1.3 | 2.1 |
| Population | Species | Species | Individuals |
| Population A | I | Mammals | 3 |
| II | Birds | 2 | |
| III | Amphibians | 2 | |
| Population B | I | Mammals | 2 |
| II | Mammals | 2 | |
| III | Amphibians | 1 | |
| Population C | I | Mammals | 3 |
| II | Mammals | 2 | |
| III | Mammals | 4 |
| | Maximum diversity | Minimum diversity |
| (a) | Population B | Population C |
| (b) | Population A | Population C |
| (c) | Population A | Population B |
| (d) | Population B | Population A |
$\text{D}=\displaystyle\sum_{\text{i}=1}(\text{n}_\text{i}/\text{N})^2$
where, n = total number of organisms of particular species
N = total number of organisms of all species
Below are data collected in two terrestrial plant conununities that represent part of a successional chronosequence. ln this case the values were measured as percent cover.
| Early Successional Community | Late Successional Community | ||
| Species | Percent Cover | Species | Percent Cover |
| A | 83 | F | 24 |
| B | 5 | G | 20 |
| C | 9 | H | 18 |
| D | 2 | I | 23 |
| E | 1 | J | 15 |
| | Species Richness | Evenness |
| (a) | Higher | Higher |
| (b) | Higher | Lower |
| (c) | Same | Lower |
| (d) | Same | Higher |
Reason: Trichoderma release enzyme which inhibits growth of several disease causing pathogens.