Questions

Case study (4 Marks)

🎯

Test yourself on this topic

10 questions · timed · auto-graded

Question 14 Marks
Use the given information to answer the following questions.
Image

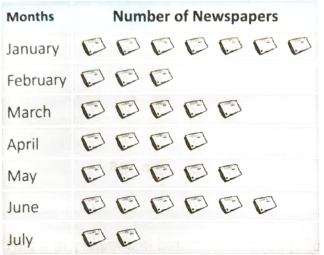
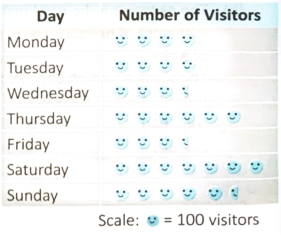
(a) In which months the same number of newspapers were sold?
(b) How many newspapers does the symbol Image represent, if 3,50,000 newspapers were sold in the month of January?
(c) In which month were the least number of newspapers sold?
(d) How many newspapers were sold over a 7 month period, if each symbol Image equals 7000 newspapers?
Answer
(a) March and July
(b) 50000
(c) July
(d) 2,24,000
View full question & answer
Question 24 Marks
The given pictograph represents the number of people who visited a museum during a week.
answer the following questions.
Image
Now, answer the following questions.
(a) On which day did maximum number of people visit the museum?
(b) How many more people visited the museum on Saturday than on Thursday?
(c) If the profit of 20 was made on the sale of each entry ticket, find the total profit made on Sunday.
(d) Can you represent the same information in a bar graph? If yes, try it.
Answer
(a) Saturday
(b) 100
(c) ₹11,000(d) Self
View full question & answer
Question 34 Marks
The following data gives the number of children in 20 families.
2, 3, 3, 1, 2, 2, 2, 4, 1, 4, 5, 1, 5, 4, 1, 1, 2, 3, 2, 2
Make a table and enter the data using tally marks. Find:
(a) how many families have 3 children?
(b) how many families have less than 3 children?
Answer
Image
(a) 3 (b) 12
View full question & answer
Question 44 Marks
Represent the following data using a bar graph.
Various modes of transport used by 2000 students of a school are as follows.
Modes of transportCarCyclePrivate VanSchool BusWalking
Number of students250380220750400
View full question & answer
Question 54 Marks
Represent the following data using a bar graph.
The number of Mathematics books sold by a shopkeeper on six consecutive days is given below.
DayMondayTuesdayWednesdayThirsdayFridaySaturday
Number of books sold503540706065
View full question & answer
Question 64 Marks
Represent the following data using a bar graph.
In a particular day of March 2023 at Delhi, the temperature is recorded as under.
Time12:00 noon2:00p.m.4:00p.m.6:00 p.m.8:00p.m.10:00 p.m.
Temperature (°C)283230282624
View full question & answer
Question 74 Marks
Marks obtained by 25 students in Mathematics examination out of 100 are given below:
63, 41, 87, 63, 33, 49, 78, 91, 80, 37, 52, 55, 68, 71, 43, 37, 51, 50, 67, 75, 76, 39, 52, 71, 81
(a) Arrange the data in ascending order.
(b) Find out the lowest marks obtained.
(c) How many students have scored more than 75 marks?
(d) How many students have scored less than 50 marks?
Answer
(a) 33,37,37,39,41,43,49,50,51,52,52,55,63,63,67,68,71,71,75,76,78,80,81,87,91
(b) 33
(c) 6 students
(d) 7 students
View full question & answer
Question 94 Marks
Following is the choice of sweets of 30 students of Class VI. Ladoo, Barfi, Ladoo, Jalebi, Ladoo, Rasgulla, Jalebi, Ladoo, Barfi, Rasgulla, Ladoo, Jalebi, Jalebi, Rasgulla, Ladoo, Rasgulla, Jalebi, Ladoo, Rasgulla, Ladoo, Ladoo, Barfi, Rasgulla, Rasgulla, Jalebi, Rasgulla, Ladoo, Rasgulla, Jalebi, Ladoo.
(a) Arrange the names of sweets in a table using tally marks.
(b) Which sweet is preferred by most of the students?
Answer
self
View full question & answer
Question 104 Marks
Catherine threw a dice 40 times and noted the number appearing each time as shown below:
Image
Make a table and enter the data using tally marks. Find the number that appeared. "
(a) The minimum number of times
(b) The maximum number of times
(c) Find those numbers that appear an equal number of times.
Answer
self
View full question & answer
Case study (4 Marks) - MATHS STD 6 Questions - Vidyadip