Question 13 Marks
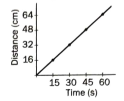
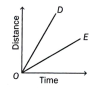
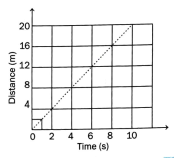
Complete the data of the table given below with the help of the distance-time graph given in figure.
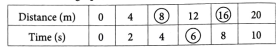
Distance (m) | 0 | 4 | ? | 12 | ? | 20 |
Time (s) | 0 | 2 | 4 | ? | 8 | 10 |
Answer
View full question & answer→This distance-time graph shows that the body is moving with a constant speed. It means that, it covers equal distance in equal interval of time. So, with the help of distance-time graph, the data can be completed as