Question 15 Marks
The following observed values of x and y are thought to satisfy a linear equation. Write the linear equation
Draw the graph, using the values of x, y as given in the above table. At what points the graph of the linear equation
| x | 6 | -6 |
| y | -2 | 6 |
- Cuts the X-axis?
- Cuts the Y- axis?
Answer
View full question & answer→Given, points are (6, -2) and (-6, 6) Let the linear eqution y = mx + c is satisfied by the points (6, -2) and (-6, 6) then at point (6, -2) $-2=6\text{m}+\text{c}\ ....(\text{i})$ $6=-6\text{m}+\text{c}\ ....(\text{ii})$ and at point (-6, 6). On subtracting Eq. (ii) from Eq. (i), we get $12\text{m}=-8\Rightarrow\text{m}=\frac{-8}{12}\Rightarrow\text{m}=-\frac{2}{3}$ On putting the value of min Eq. (i), we get $-2=6\Big(\frac{-2}{3}\Big)+\text{c}$ $\Rightarrow-2=-4+\text{c}\Rightarrow\text{c}=-2+4\Rightarrow\text{c}=2$ Om putting $\text{m}=-\frac{2}{3}$ and c = 2 in linear eqution y = mx + c we get 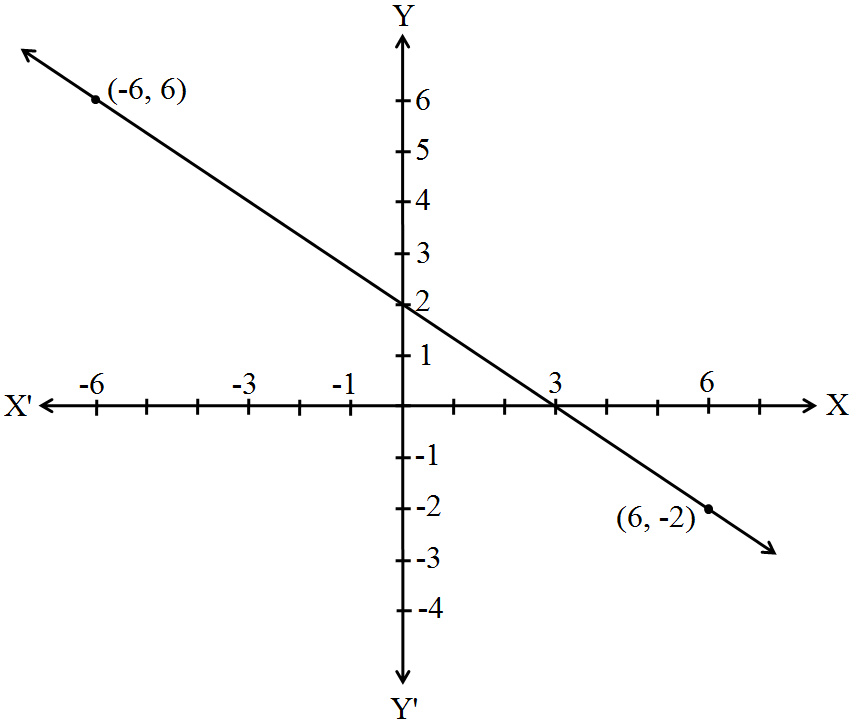 $\Rightarrow\text{y}=-\frac{2}{3}\text{x}+2$ $\Rightarrow\text{y}=\frac{-2\text{x}+6}{3}$ $\Rightarrow3\text{y}=-2\text{x}+6$ $\Rightarrow3\text{y}+2\text{x}=6$ When the graph of the linear equation
$\Rightarrow\text{y}=-\frac{2}{3}\text{x}+2$ $\Rightarrow\text{y}=\frac{-2\text{x}+6}{3}$ $\Rightarrow3\text{y}=-2\text{x}+6$ $\Rightarrow3\text{y}+2\text{x}=6$ When the graph of the linear equation - Cuts the X-axis
Then, put y = 0 in eqution 2x + 3y = 6, we get
2x + 3.0 = 6
⇒ 2x = 6
$\therefore$ x = 3
When the graph of the linear equation
- Cuts the Y-axis
Then, put x = 0 in eqution 2x + 3y = 6, we get
2.0 + 3y = 6
⇒ 3y = 6
$\therefore$ y = 2
Therefore, the graph the linear eqution cuts the X-axis at the point (3, 0) and the Y-axis at the point (0, 2).