Question 15 Marks
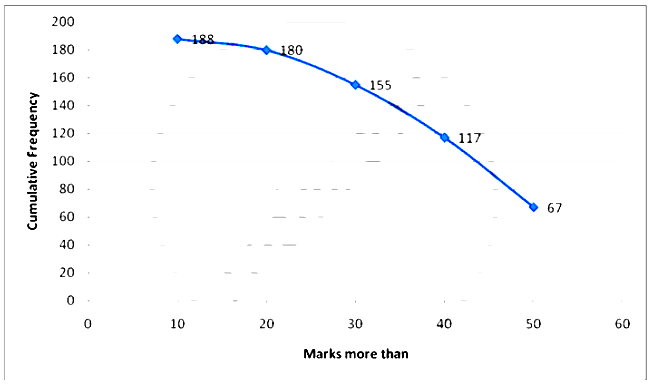
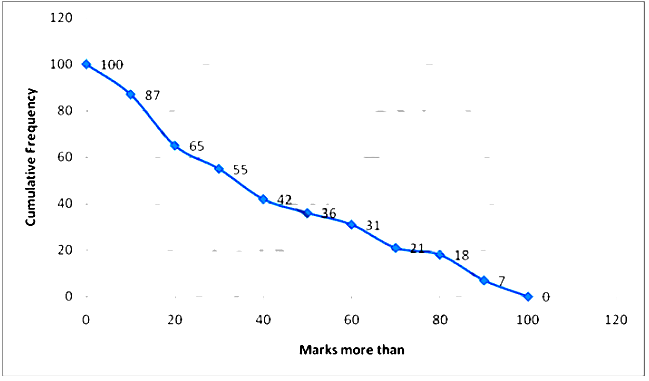
Draw an ogive for the following :
| Marks (More than) | 0 | 10 | 20 | 30 | 40 | 50 | 60 | 70 | 80 | 90 | 100 |
| Cumulative Frequency | 100 | 87 | 65 | 55 | 42 | 36 | 31 | 21 | 18 | 7 | 0 |
Answer
View full question & answer→Steps:
1. Start with lower limits of class intervals and from cumulative frequency, subtract the frequency of each class to obtain c.f distribution .
2. Mark lower class limits along $x$-axis $.1 \mathrm{~cm}=5$ units
3. Mark cumulative frequencies along y-axis. $1 \mathrm{~cm}=5$ units
4. Plot points $(x, f)$ where $x$ is the lower limit of one class and $f$ is the corresponding c.f. $(0,100),(10,87)$, $(20,65),(30,55),(40,42),(50,36),(60,31),(70,21),(80,18),(90,7),(100,0)$
5. Join the points to get the ogive.
| Marks more than | Cumulative Frequency |
| 0 | 100 |
| 10 | 87 |
| 20 | 65 |
| 30 | 55 |
| 40 | 42 |
| 50 | 36 |
| 60 | 31 |
| 70 | 21 |
| 80 | 18 |
| 90 | 7 |
| 100 | 0 |