Question types

Graphical Representation of Statistical Data question types

26 questions across 3 question groups — pick any mix to generate a MATHS paper with step-by-step answer keys.

26
Questions
3
Question groups
5
Question types
Sample Questions

Graphical Representation of Statistical Data questions

One sample from each question group in this chapter. Select any group above to see the full set with answer keys.

Q 1[4 marks sum]4 Marks
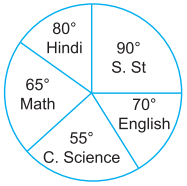
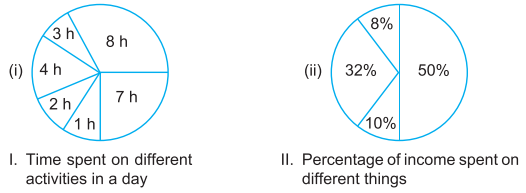
The pie-diagram given below shows the expenditure during a month on various items made by an officer in his family, earning ₹ 12000 per month.
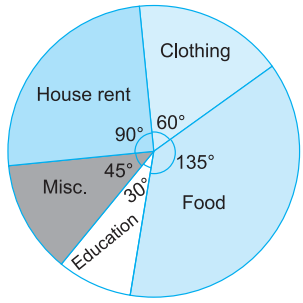
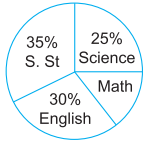
Read the pie-diagram carefully and answer the following questions.
(i) How much does he spend on food?
(ii) What percentage of his income is spent on house rent?
(iii) How much does he spend on miscellaneous items?
(iv) What is the ratio of expenditure on clothing to that on education?
Image
View full solution
Q 2[4 marks sum]4 Marks
The expenditure of a company during a year was divided as follows :
HeadPercentage of expenditure
Wages and salaries$40 \%$
Fuel and Power$10 \%$
Materials$25 \%$
Maintenance$20 \%$
Depreciation$5 \%$
Draw a pie-chart depicting the above data.
View full solution
Q 3[4 marks sum]4 Marks
The following table shows the percentage of buyers of different brands of bathing soaps :
BrandABCDE
Percentage of buyers$20 \%$$35 \%$$25 \%$$15 \%$$5 \%$
Draw a pie-diagram to represent the above data.
View full solution
Q 4[4 marks sum]4 Marks
Mr. Roy's monthly income is ₹15000. Out of this money, he spends ₹1875 on rent, ₹3250 on food, ₹ 1125 on children's education, ₹ 2250 on miscellaneous and the rest he saves.
Draw a pie chart to represent the above information.
View full solution
Q 5[4 marks sum]4 Marks
The money spent on a book by a publisher is given below :
ItemPaperPrintingBindingPublicityRoyalty
Money spent (in ₹)2512689
Draw a pie-diagram to represent the above data.
View full solution
Q 7[5 marks sum]5 Marks
View full solution
Q 8MCQ1 Mark
The given pie chart shows the marks scored by a student in an examination in 5 subjects. If the total marks obtained by the student were 540, then the subject in which he scored 120 marks is :
Image
  • A
    English
  • B
    Math
  • Hindi
  • D
    S. St.

Answer: C.

View full solution
Q 9MCQ1 Mark
In a pie chart, that represents different fast foods sold in a shop, Momos accounts for $60 \%$ of the sales. What angle will the sector of Momos make in the pie-chart?
  • $216^{\circ}$
  • B
    $105^{\circ}$
  • C
    $80^{\circ}$
  • D
    $60^{\circ}$

Answer: A.

View full solution
Q 10MCQ1 Mark
In a pie chart that shows different types of soft drinks sold in a shop, Maza makes an angle of $72^{\circ}$ at the centre. What percentage of the total cold drink sale is Maza?
  • A
    $10 \%$
  • B
    $15 \%$
  • $20 \%$
  • D
    $72 \%$

Answer: C.

View full solution
Q 11MCQ1 Mark
The pie chart shows the number of students in a class with various subjects. What angle represents Math?
Image
  • A
    $42^{\circ}$
  • B
    $40^{\circ}$
  • $36^{\circ}$
  • D
    $10^{\circ}$

Answer: C.

View full solution
Q 12MCQ1 Mark
Which of the following pie charts represents the data accurately?
Image
  • A
    I
  • II
  • C
    both
  • D
    none

Answer: B.

View full solution

Generate a Graphical Representation of Statistical Data paper free

Pick question groups from the list above, set marks and difficulty, and export a branded PDF with step-by-step answer keys. First 3 chapters free — no signup.

Download App